. 2018 Nov 7;7:e37688. doi: 10.7554/eLife.37688

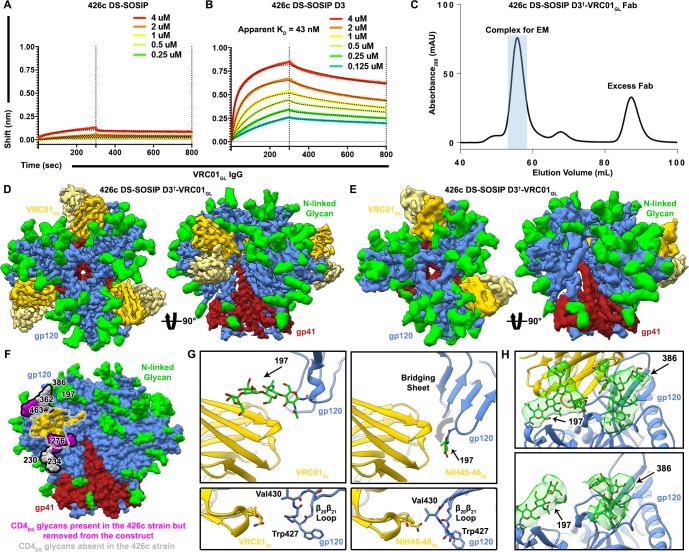
Figure 1. Structural characterization of the 426c DS-SOSIP D3-VRC01GL complex.

(A–B) BLI binding data of immobilized VRC01GL IgGs binding to WT 426c DS-SOSIP (A) or 426c DS-SOSIP D3 trimers. The concentrations of 426c DS-SOSIP trimers injected are indicated on each panel. Fit curves are colored as black dotted lines. A KD could not be determined in (A) due to the weak responses observed. The vertical dotted lines indicate the transition between association and dissociation phases. (C) Size-exclusion chromatogram of the purified 426c DS-SOSIP D3-VRC01GL complex used for cryoEM structure determination. The pooled fractions used for cryoEM are highlighted in light blue. (D) Two orthogonal views of the 3.8 Å cryoEM reconstruction sharpened with a B-factor of −250 Å2 whereas the glycan density is shown unsharpened. (E) Two orthogonal views of the asymmetric 4.8 Å reconstruction with two bound Fabs. (F) Surface representation of the 426c SOSIP trimer highlighting differences in glycosylation compared to the BG505 SOSIP. Glycans not present in 426c are colored light-gray and outlined. Glycans present in the 426c strain but removed by mutation from the 426c DS-SOSIP D3 construct are colored magenta and outlined. The gp120 surface buried at the interface with VRC01GL is indicated as a dotted outline and is colored yellow. (G) Comparison of the gp120 bridging sheet conformation when VRC01GL-class Fabs are bound to either 426c DS-SOSIP D3 trimer (Top-left) or a previously solved 426c gp120 core lacking selected NLGSs, such as the Asn276 NLGS (PDB: 5IGX) (Top-right). Comparisons of β20β21 loop conformations of each complex are shown below corresponding top panels. (H) Comparison of glycan density and position between VRC01GL-bound and VRC01GL-free protomers in the asymmetric cryoEM reconstruction shown in (E). (Top) Asn197 and Asn386 glycan density is stronger for protomers bound to VRC01GL Fab than for the gp120 protomer not bound to VRC01GL (Bottom). In panels D-H, gp120 protomers are shown in blue, gp41 in red, N-linked glycans in green and VRC01GL in dark and light yellow for the heavy and light chains, respectively.

Figure 1.

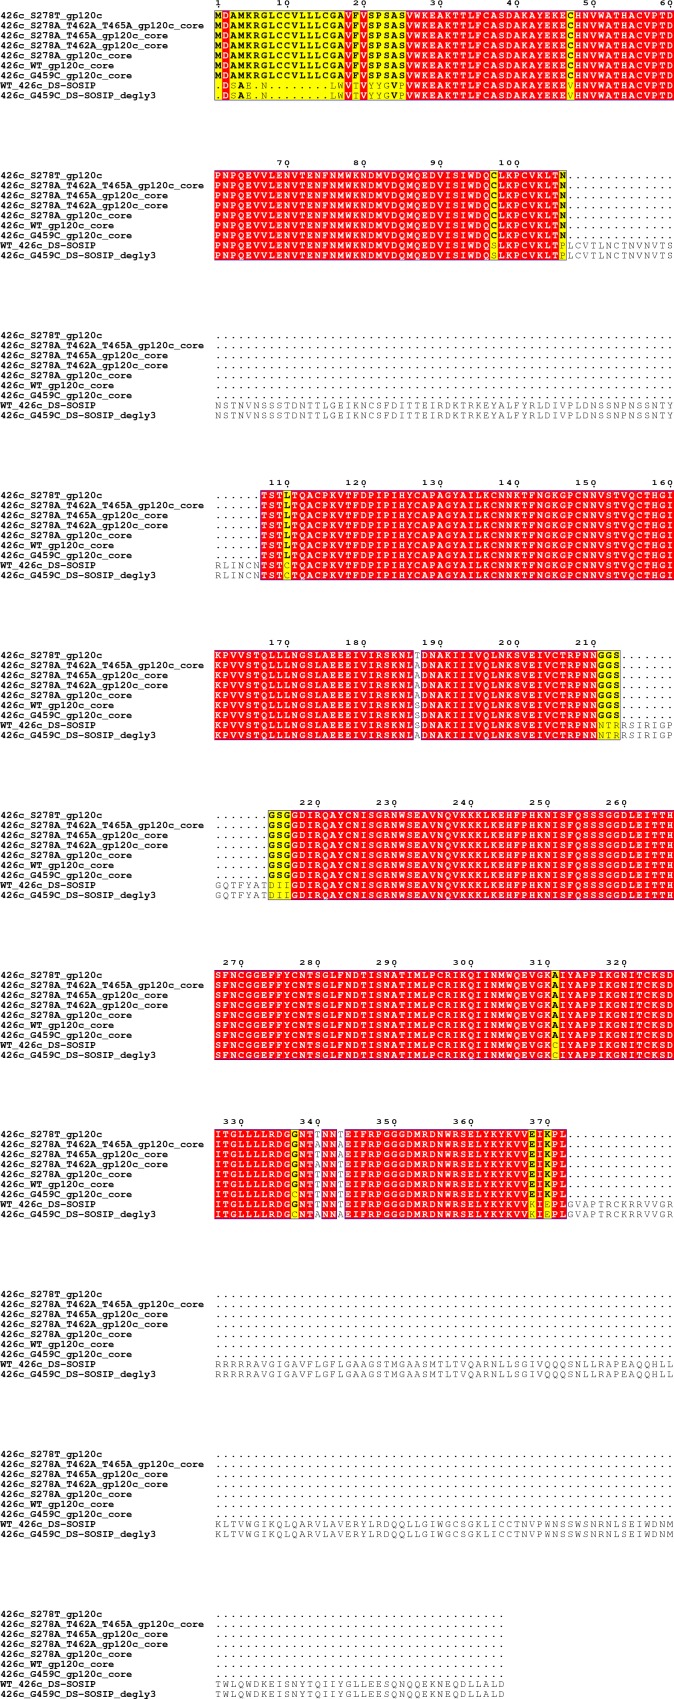
Figure 1—figure supplement 1. Multiple sequence alignment of analyzed HIV-1 426c constructs.

Figure 1—figure supplement 1.

HIV-1 constructs derived from the 426c strain used in this study were subjected to multiple sequence alignment using Clustal Omega and rendered using ESPript (Gouet et al., 1999; Sievers and Higgins, 2014). Residues highlighted in red signify identical amino acids conserved across all aligned constructs. Similar residues are highlighted in bold and colored yellow.
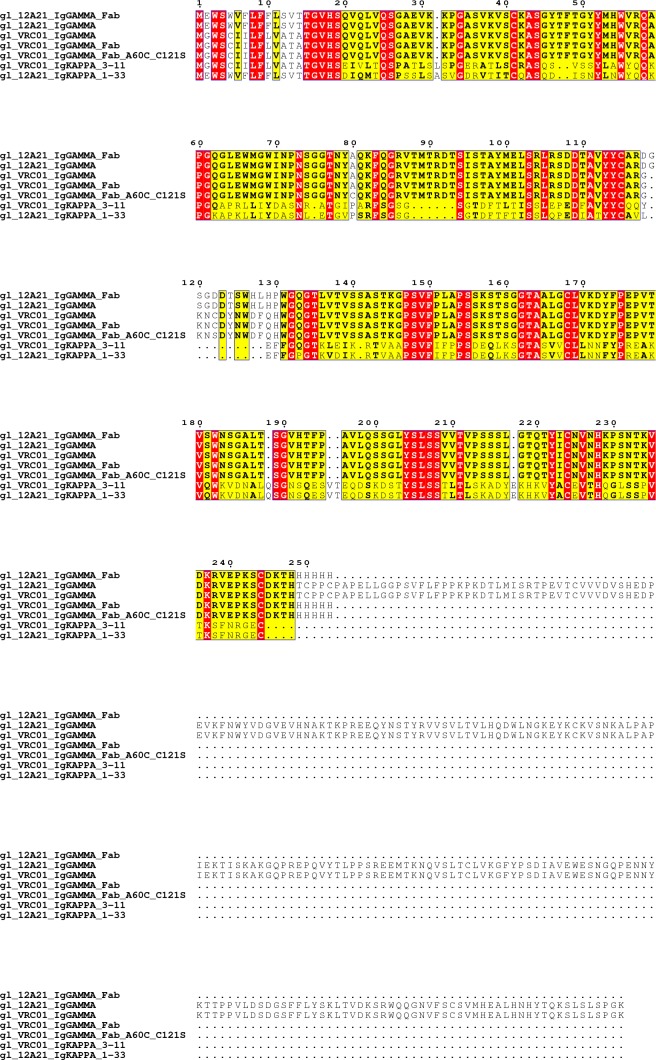
Figure 1—figure supplement 2. Multiple sequence alignment of analyzed antibody and Fab constructs.

Figure 1—figure supplement 2.

VRC01GL-class antibody and Fab constructs used in this study were subjected to multiple sequence alignment using Clustal Omega and rendered using ESPript (Gouet et al., 1999; Sievers and Higgins, 2014). Residues highlighted in red signify identical amino acids conserved across all aligned constructs. Similar residues are highlighted in bold and colored yellow.
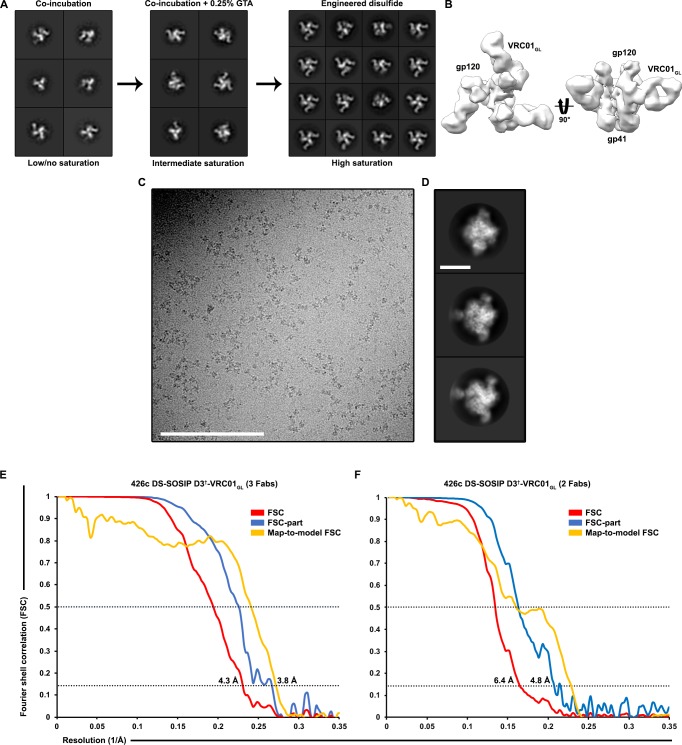
Figure 1—figure supplement 3. Structural characterization of the 426c DS-SOSIP D3-VRC01GL complex.

Figure 1—figure supplement 3.

(A) Strategy implemented to increase the occupancy of VRC01GL Fab for structural studies. VRC01GL can engage 426c DS-SOSIP D3, but its low apparent affinity relative to VRC01GL IgG precludes saturation at the concentrations used for negative staining EM imaging (Left). Mild glutaraldehyde (GTA) crosslinking (0.25% GTA for 45 s followed by quenching with 1M Tris) increased VRC01GL saturation of 426c DS-SOSIP D3 (Middle). Engineering a disulfide bond between 426c DS-SOSIP D3 (G459Cgp120) and the heavy chain of VRC01GL (A60CHC) further increased gp120 saturation of the trimer (Right). (B) 3D reconstruction of negatively stained 426c DS-SOSIP D3-VRC01GL. (C–D) Representative micrograph (E) and 2D class averages (F) of frozen-hydrated 426c DS-SOSIP D3-VRC01GL. Scale bars represent 200 nm (E) or 200 Å (F). (E) Fourier shell correlation (FSC) curves of the 426c DS-SOSIP D3-VRC01GL complex with three Fabs bound showing an estimated resolution of 3.8 Å. (F) Fourier shell correlation curves of the 426c DS-SOSIP D3-VRC01GL complex with two Fabs bound showing an estimated resolution of 4.8 Å. The top and bottom horizontal dashed lines show the 0.5 and 0.143 cutoffs used for resolution estimates for map-to-model or gold-standard FSC, respectively. Both conventional FSC and FSC-part, as reported in Frealign, are shown.
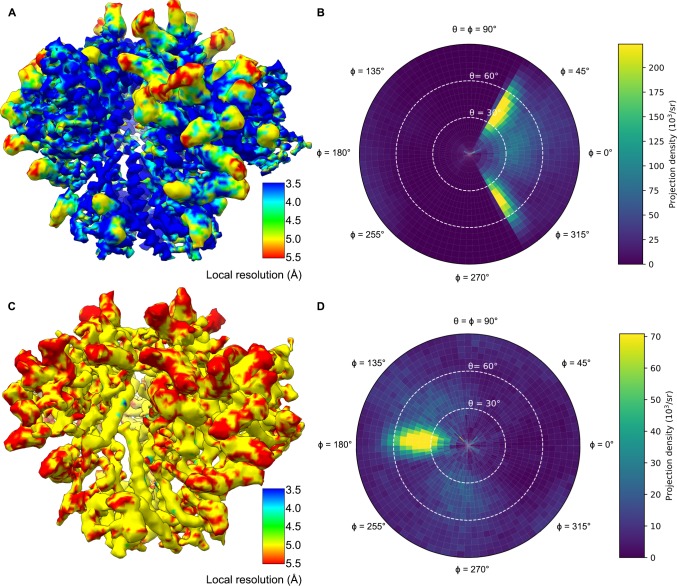
Figure 1—figure supplement 4. Validation of the 426c DS-SOSIP D3-VRC01GL cryoEM reconstructions.

Figure 1—figure supplement 4.

(A) Local resolution estimates of 426c DS-SOSIP D3 bound to three copies of VRC01GL-A60CHC as determined using ResMap (Kucukelbir et al., 2014). (B) Graphical plot depicting distribution of particle image orientations. (C) Local resolution estimates of 426c DS-SOSIP D3 bound to two copies of VRC01GL-A60CHC as determined using ResMap(Kucukelbir et al., 2014). (D) Graphical plot depicting distribution of particle image orientations.
Figure 1—figure supplement 5. Comparison of gp120 interface contacts between VRC01GL and VRC01MAT.
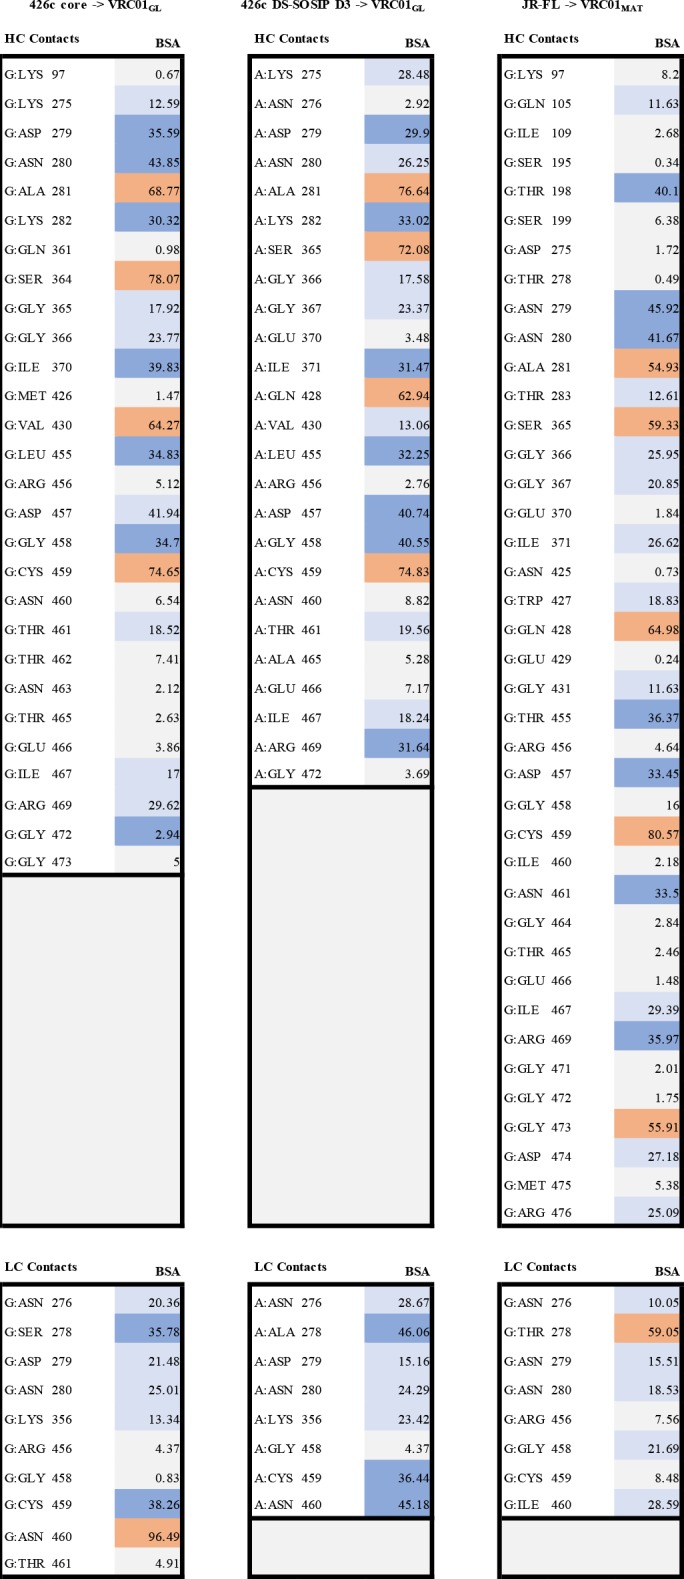
Figure 1—figure supplement 5.

Tables highlighting gp120 residues and their associated buried surface area (BSA) which comprise the interface with VRC01-class antibodies, as determined by PISA. BSA values are colored light gray for values ranging between 0.1 and 10.0, light blue for values between 10.1 and 30.0, dark blue for values between 30.1 and 50.0, and red for values > 50.0 Å2. HC: heavy chain; LC: light chain.
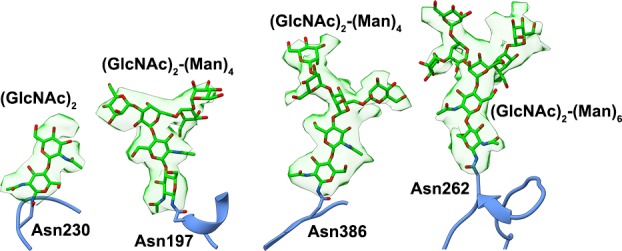
Figure 1—figure supplement 6. Example of glycans resolved in the 426c DS-SOSIP D3-VRC01GL structure.

Figure 1—figure supplement 6.

CryoEM density (green semi-transparent surface) and atomic model for glycans at positions Asn230, Asn197, Asn386 and Asn262 are shown.