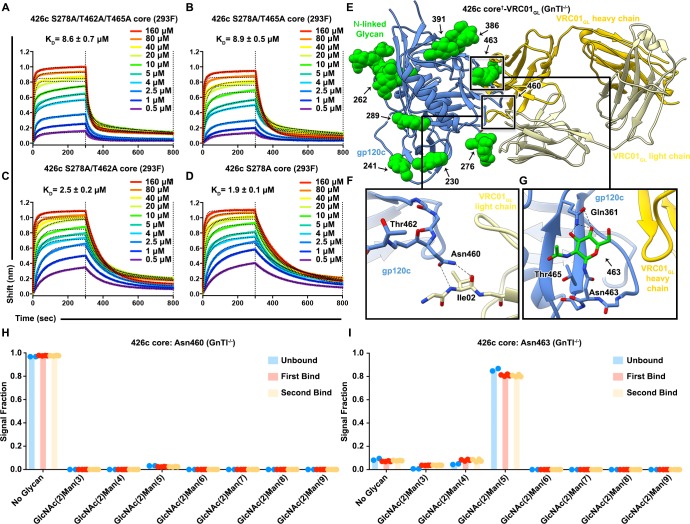
Figure 2. Reintroduction of V5 loop NLGSs does not hinder VRC01GL binding to the 426c core.
(A–D) BLI curves and the corresponding equilibrium dissociation constants for VRC01GL IgG binding to the S278A/T462A/T465A (A), S278A/T462A (B), S278A/T465A (C), and S278A (D) 426c core constructs lacking either one or several glycans in the V5 and D loops. The concentrations of 426c core injected and the color key is indicated on each panel. Fitted curves are colored as black dotted lines. The vertical dashed lines indicate the transition between association and dissociation phases. (E) Ribbon diagram of the 426c core†-VRC01GL complex crystal structure. gp120 is colored blue, VRC01GL Fab is colored yellow (heavy chain: dark yellow; light chain: light yellow), and resolved gp120 glycans are shown in surface representation and colored green. (F) Close-up view of the gp120 Asn460 contacts with the backbone carbonyl and amide groups of the light chain VRC01GL residue Ile02. (G) Close-up view of the (GlcNAc)1 at position Asn463 of gp120. Oligosaccharides are labeled by the corresponding Asn residue they are linked to. Hydrogen bonds are represented as dashed lines. (H–I) Semi-quantitative LC-MS/MS analysis of VRC01GL-based IP experiments depicting the relative signal intensities for identified Asn460 (H) and Asn463 (I) glycoforms in unbound (blue), first binding event (red), and second binding event (yellow) fractions. The ‘unbound’ material indicates 426c core glycoforms that did not bind VRC01GL well following three binding steps. The ‘first’ binding event corresponds to 426c core elution fractions following collection of the sample flow-through and three rigorous wash cycles. The ‘second’ binding event follows a rebinding of the aforementioned flow-through, performing three additional washes, and eluting any residual bound material from the VRC01GL affinity column and collecting this fraction. Colored dots associated with their corresponding histogram bars represent individual values extracted from each experimental replicate, with the bar itself representing the experimental mean signal fraction.


