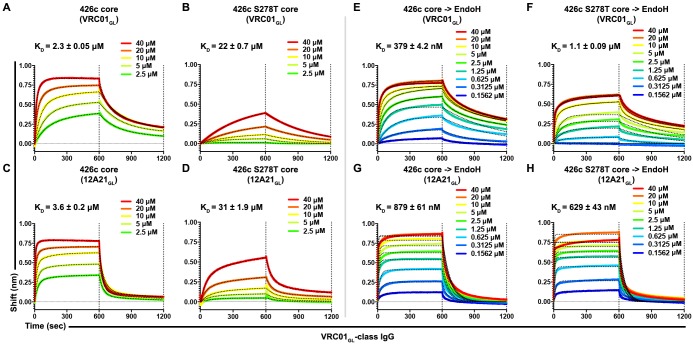
Figure 6. Asn276 glycosylation frequency modulated VRC01GL-class IgGs recognition of the 426c core.
(A–D) BLI binding data and associated KD values of 426c core constructs, expressed in HEK293 GnTI-/- cells, with two immobilized VRC01GL-class IgGs. VRC01GL IgG binding was assessed against the 426c core (A) and the 426c S278T core (B). 12A21GL binding to the 426c core (C) and 426c S278T core (D) were also tested. (E–H) BLI binding data and corresponding KD values of 426c core constructs, expressed using HEK293 GnTI-/- cells and treated with EndoH, with VRC01GL-class IgGs. VRC01GL IgG binding was assessed against the EndoH-treated 426c core (E) and the 426c S278T core (F). 12A21GL interactions with the EndoH-treated 426c core (G) and 426c S278T core (H) were also tested. The concentrations of 426c core injected and the color key are indicated on each panel. Fit curves are colored as black dotted lines. The vertical dotted lines indicate the transition between association and dissociation phases.


