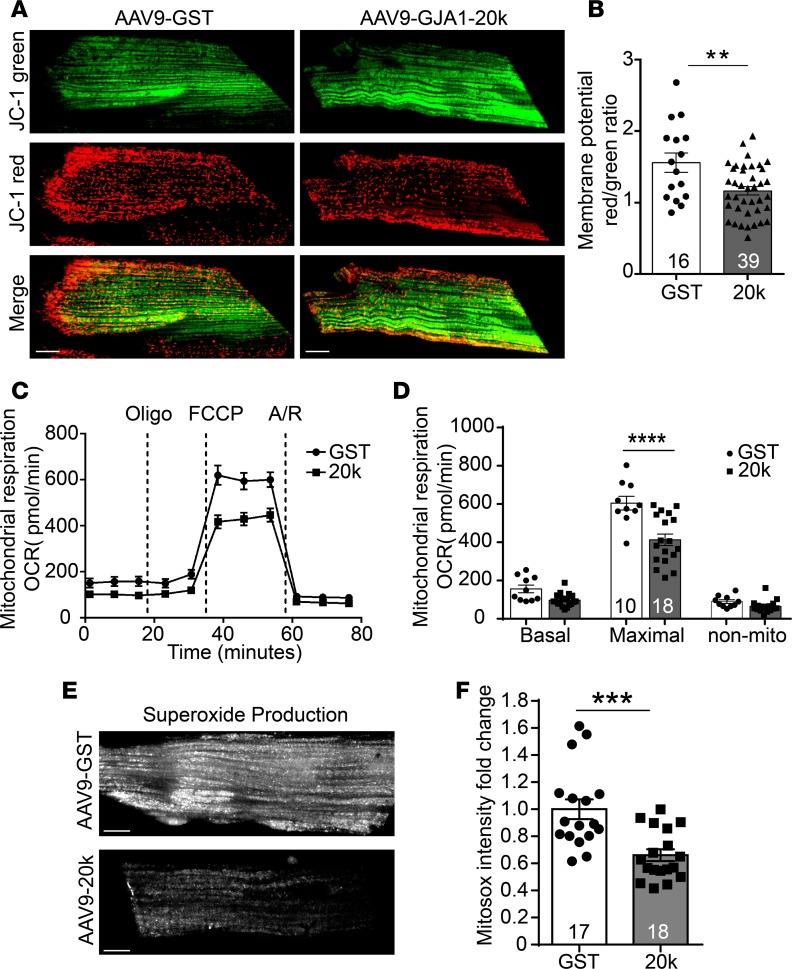
Figure 7. GJA1-20k promotes mitochondrial quiescence.
(A) Cardiomyocytes isolated from AAV9-GJA1-20k– or AAV9-GST–expressing hearts were loaded with JC-1 MitoTracker dye, which selectively enters mitochondria and reversibly changes color from JC-1 red to JC-1 green as the membrane potential decreases. (B) Ratiometric measurement (red/green) using JC-1 in the two groups (number of cells quantified is shown on the graph). Data are mean ± SEM. **P < 0.01, unpaired t test. (C) Seahorse XF Cell Mito Stress assay is used for characterization of oxygen consumption rate (OCR) in cardiomyocytes isolated from AAV9-GJA1-20k or AAV9-GST hearts. OCR under basal conditions and in response to the indicated mitochondrial inhibitors is shown overtime. (D) Quantification of basal respiration, maximal respiratory, and nonmitochondrial respiration between the two groups. Data are mean ± SEM (number of wells assessed per group is shown on the graph). ****P < 0.0001, 2-way ANOVA. (E) Cardiomyocytes isolated from AAV9-GJA1-20k– or AAV9-GST–expressing hearts were loaded with the fluorogenic dye MitoSOX Red to examine mitochondrial superoxide production by assessing fluorescence intensity, which is quantified in F as fold change (n = 17 cells for GST and n = 18 cells for 20k hearts). Data in F are mean ± SEM. ***P < 0.001, unpaired t test. Scale bar: 10 μm.

