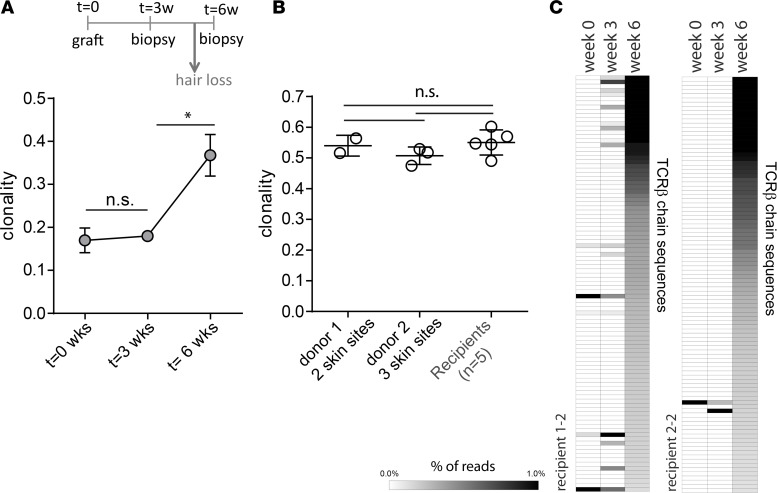
Figure 3. T cell clonal expansions coincide with hair loss.
Skin biopsies were taken from C3H/HeJ recipient mice at time of skin grafting t = 0 and 3 and 6 weeks after grafting, and the TCRβ chains were sequenced by high-throughput sequencing. The clonality (defined by 1 minus the normalized entropy) is plotted for recipient (n = 2) skin at the 3 different time points. *P < 0.05, 2-tailed Student’s t test (A). Clonality of affected skin samples from 2 donors with longstanding alopecia and from affected skin samples from 5 recipients with recent-onset, graft-induced alopecia. Statistical analysis was performed with 1-way ANOVA (B). The frequencies of the 100 most dominant TCRβ sequences in affected skin from 2 recipient mice at week 6 were determined at week 0 and 3. The frequencies are depicted as heatmaps (C).

