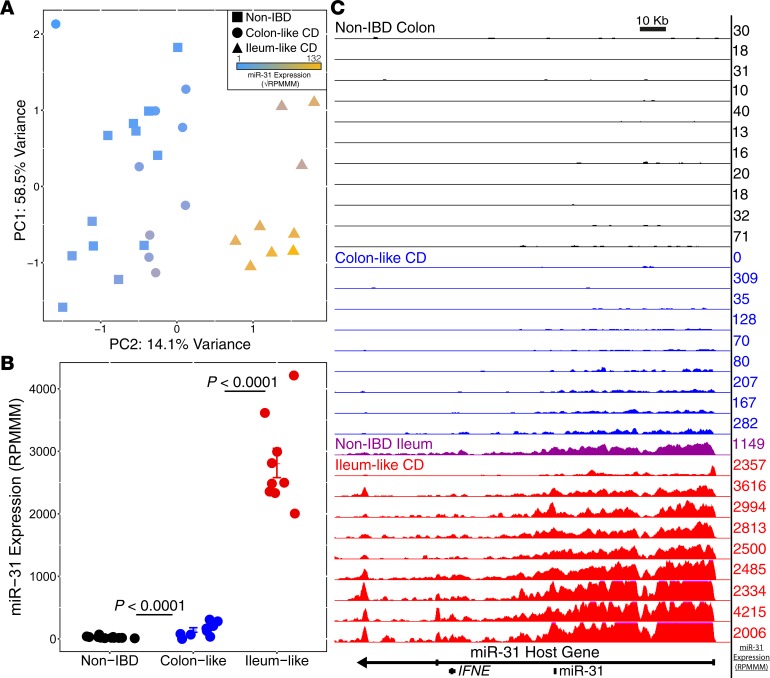
Figure 2. miR-31 is a driver of colon-like and ileum-like stratification.
(A) Principal components analysis of miRNA expression data from small RNA-seq. miR-31 expression (blue–gold, low–high) appears to distinguish the NIBD (n = 12) and colon-like samples (n = 9) from ileum-like samples (n = 9). (B) Normalized miR-31 expression exhibits a significant upregulation in Crohn’s disease subgroups (colon-like, n = 9; ileum-like, n = 9) samples compared with NIBD samples (n = 12). (C) UCSC browser representation of normalized RNA-seq reads mapping to the miR-31 host gene for NIBD colon (black, n = 11), colon-like CD (blue, n = 9), NIBD ileum (purple, n = 1), and ileum-like CD (red, n = 9). miR-31 transcript expression levels from small RNA-seq (RPMMM) are displayed to the right of each track. FDR adjusted P values determined using DESeq2, with data presented as mean RPMMM ± SEM.

