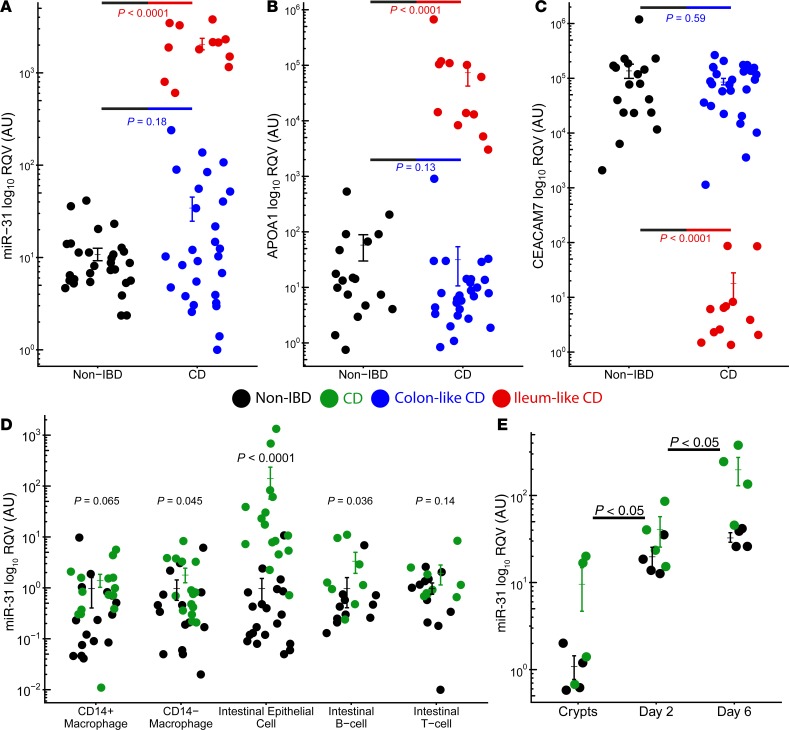
Figure 3. miR-31 is specifically upregulated in intestinal epithelial cells.
RT-qPCR for miR-31 (A), APOA1 (B), and CEACAM7 (C) in an independent adult cohort displays colon-like (blue; n = 27–28) and ileum-like (red; n = 12) clustering patterns for CD samples compared with NIBD samples (black; n = 18–29). (D) RT-qPCR of 5 colon-specific cell types reveal significant miR-31 upregulation in intestinal epithelial cells isolated from CD patients (n = 11–20) relative to NIBD controls (n = 8–16). (Eight NIBD matched and 6 CD matched across all cell types). (E) Relative miR-31 expression by qPCR of colonoid cultures generated from NIBD controls (n = 4) compared with CD patients (n = 4). miR-31 expression is increased in fresh crypts and remains higher at day 2 and day 6 of colonoid culture. miRNA levels are relative to RNU-48 expression compared with fresh NIBD crypts. Significance values determined by a 2-tailed unpaired Student’s t test. Data are presented as mean ± SEM.

