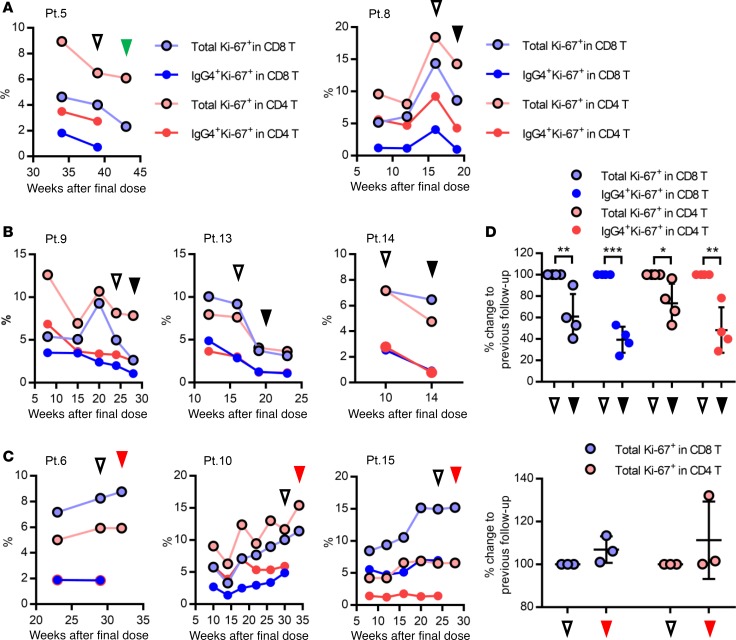
Figure 5. Following up the percentage of Ki-67 positivity in total and nivolumab-bound CD8 and CD4 T cells from patients who underwent sequential treatment.
(A–C) Fresh whole blood samples from 8 non–small cell lung cancer patients were followed up in terms of percentage of Ki-67 positivity in total and nivolumab-bound CD8 and CD4 T cells. Display order is the same as in Figure 4. Black and green triangles indicate the points of progressive disease (PD) and tumor marker re-elevation without an increase in the size of the targeted tumor (as determined by CT scan), respectively. Red triangles indicate the absolute loss of CB of nivolumab in T cells. Unfilled triangles show the follow-up time point previous to those represented by the filled triangles, as described. (D) Ki-67 positivity in T cells was compared between 2 time points: at the time of PD (black triangles) versus previous follow-up (unfilled triangles) in Pt. 8, 9, 13, and 14 (top, n = 4) and at the time of loss of CB of nivolumab (red triangles) versus previous follow-up (unfilled triangles) in Pt. 6, 10, and 15 (bottom, n = 3). Difference was calculated based on the follow-up time point, which was used as a baseline. Data represent mean ± SD. *P < 0.05, **P < 0.01, ***P < 0.001. Total Ki-67+ in CD8 T cells, P = 0.0013; IgG4+ Ki-67+ in CD8 T cells, P < 0.0001; total Ki-67+ in CD4 T cells, P = 0.0247; and IgG4+ Ki-67+ in CD4 T cells, P = 0.0029, Student’s t test.

