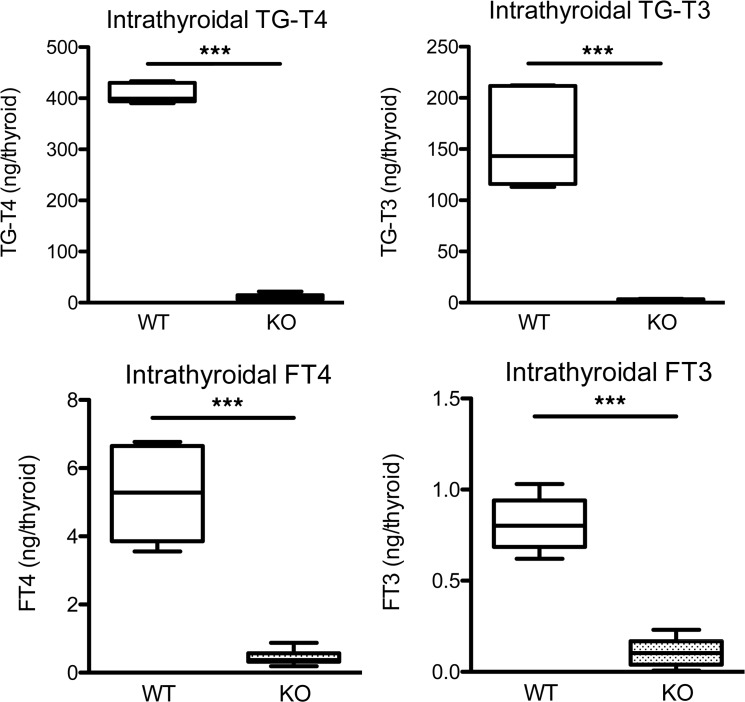
Figure 4. Intrathyroidal hormone measurements in male Slc26a7-null mice.
Box-and-whisker plots for intrathyroidal TG-bound and free (F) T4 and T3 levels in male wild-type (WT, white) and homozygous Slc26a7-null mice (KO, stippled black) age 90 days. Boxes extend from the 25th to 75th percentiles, the horizontal line represents the median, and the vertical bars represent the minimum and maximum values. Measurements were made from 6–10 mice of each genotype. P values were calculated using an unpaired 2-tailed Student’s t test. ***P < 0.0005.

