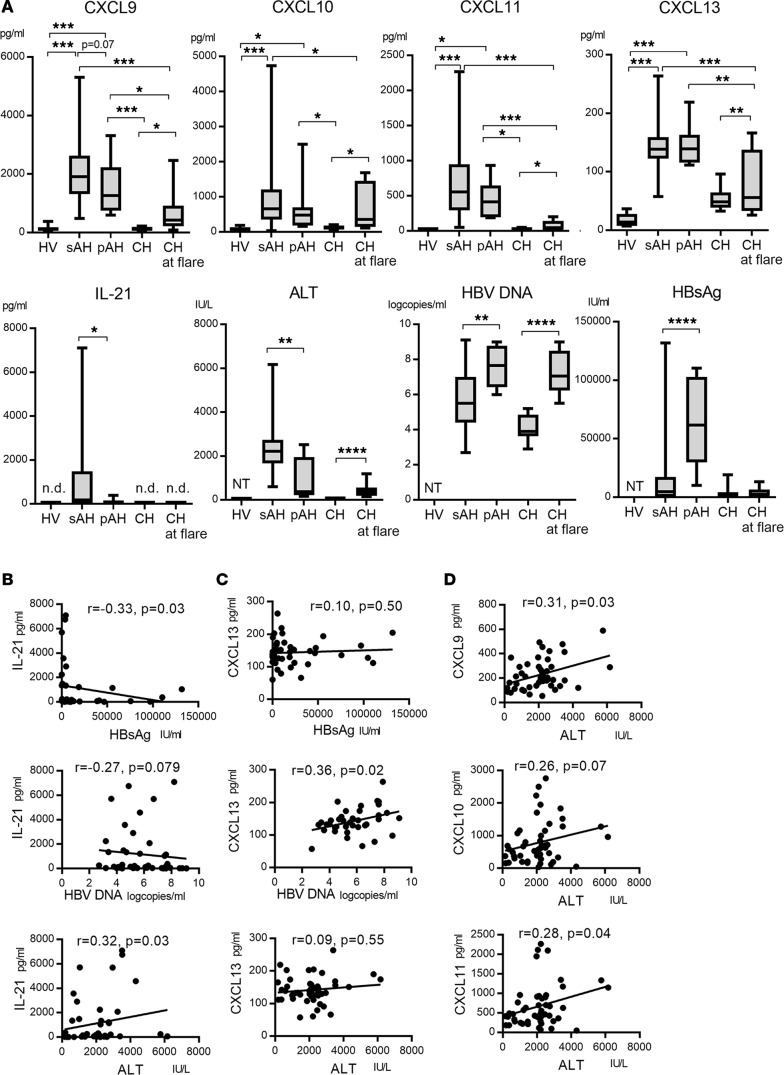
Figure 1. The comparison of serum CXCL9, CXCL10, CXCL11, CXCL13, and IL-21 levels for the patients with acute or chronic HBV infection.
(A) Serum CXCL9, CXCL10, CXCL11, CXCL13, IL-21, ALT, HBV DNA, and HBsAg levels levels are shown. For patients with sAH, pAH, or CH at flare, samples obtained at the peak of alanine aminotransferase (ALT) elevation were analyzed. HV (n = 14), healthy volunteers; sAH (n = 41), self-limited acute hepatitis B patients; pAH (n = 8), acute hepatitis B patients who fail to clear HBsAg for more than 12 months after primary HBV infection; CH (n = 8), chronic hepatitis B patients; n.d., not detected; NT, not tested. Box-and-whisker plots show median, lower and upper quartiles, and minimum and maximum values. *P < 0.05, **P < 0.01, ***P < 0.001, ****P < 0.0001 by Kruskal-Wallis test. (B) Correlations between IL-21 and serum HBsAg, HBV DNA, and ALT levels at the peak of ALT elevation in AH patients (including the sAH and pAH groups). (C) Correlations between CXCL13 and serum HBsAg, HBV DNA, and ALT levels at the peak of ALT elevation in AH patients (including the sAH and pAH groups). (D) Correlations between serum CXCL9, CXCL10, CXCL11, and ALT levels at the peak of ALT elevation in AH patients (including the sAH and pAH groups). The values for Spearman’s correlation coefficient are given in B–D.

