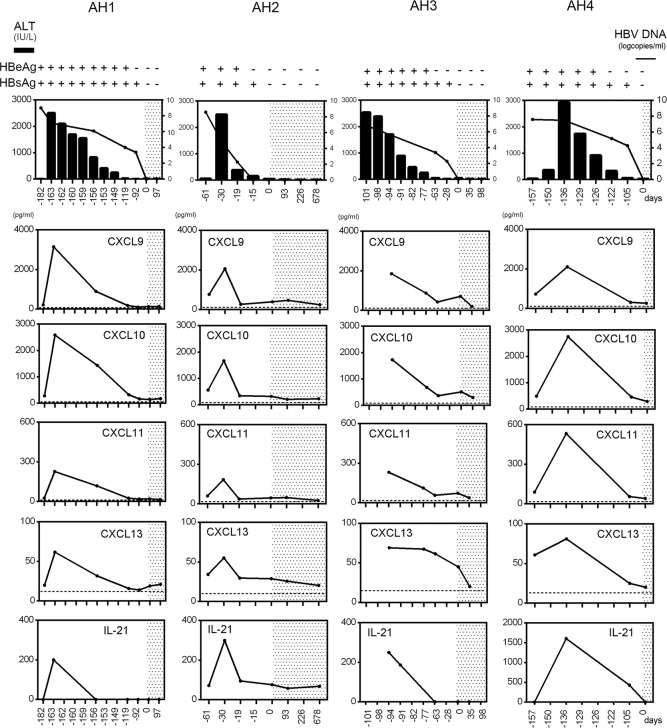
Figure 2. Longitudinal and comparative analysis of CX3CL1, CXCL9, CXCL10, CXCL11, CXCL13, and IL-21 in patients with self-limited HBV infection.
Four representative cases are shown (AH1–AH4). Dotted lines in the panels indicate the average chemokine concentration in healthy volunteers. The shaded area depicts the time period of HBsAg negativity. In top panels, the left vertical axes are for alanine aminotransferase (ALT, IU/l), and the right vertical axes are for HBV DNA (log copies/ml).

