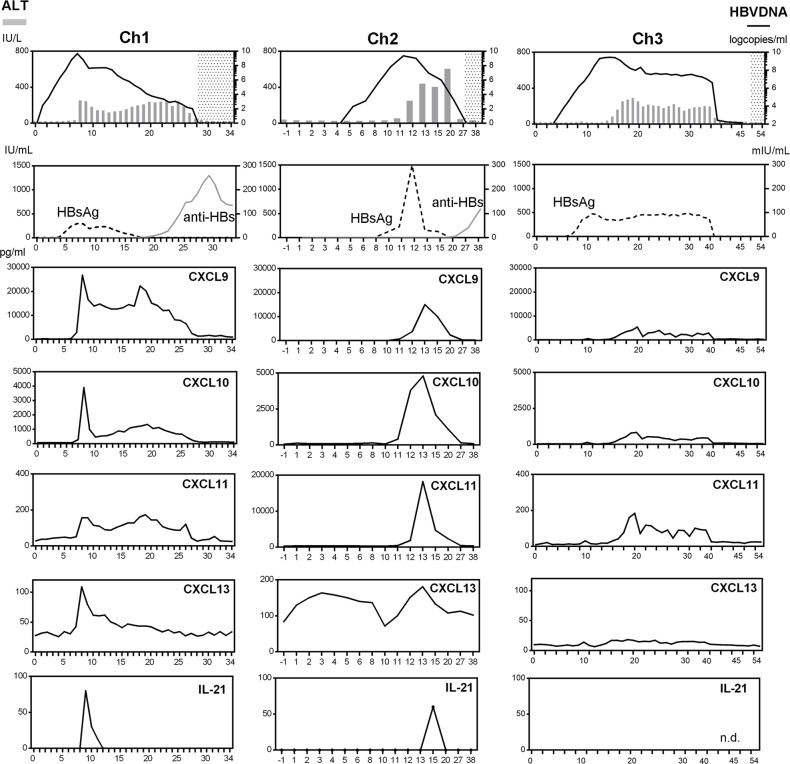
Figure 3. Sequential analyses of serum chemokines in HBV-inoculated chimpanzees.
The left vertical axes are for ALT (bar charts), HBsAg (dotted lines) and anti-HBs (solid gray lines), and the right vertical axes are for HBV DNA(solid black lines). In top panels, the shaded area depicts the time period of HBV DNA negativity. n.d., not detected.

