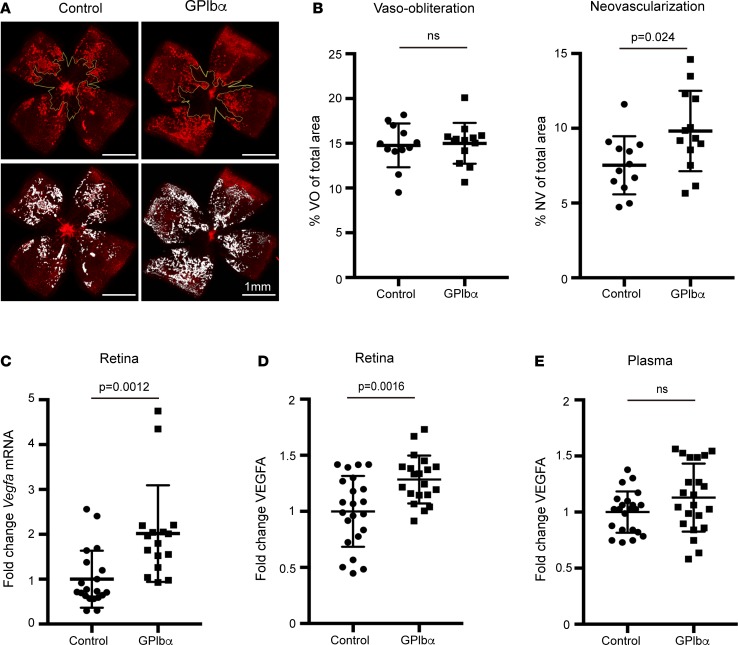
Figure 3. Platelet depletion in the OIR mouse model.
Pups with OIR were platelet depleted with anti-GPIbα antibody (n = 13 eyes) or PBS control on P15 (n = 12 eyes). (A) Representative images show the area of avascular retina or vaso-obliteration (VO) (outlined in yellow lines) in whole-mounted retina of treated (upper right panel) and control (upper left panel) pups. White areas illustrate neovascularization (NV) in treated (lower right) versus control (lower left) pups. (B) The VO area was unchanged in control pups vs. platelet-depleted pups (P = 0.81). The NV area was significantly higher in platelet-depleted pups vs. control (P = 0.024). (C) Measurement of Vegfa mRNA expression in the retina at P17. Vegfa mRNA expression was 2-fold increased after platelet depletion (n = 8 eyes; 2 technical repeats) compared with the control group (n = 10 eyes; 2 technical repeats) (P = 0.0012). (D) ELISA VEGFA protein analysis of retina at P17. VEGFA protein expression was increased after platelet depletion (n = 10 eyes; 2 technical repeats) compared with the control group (n = 11 eyes; 2 technical repeats) (P = 0.0016). (E) ELISA measurements of plasma VEGFA protein at P17 revealed no significant difference after platelet depletion (n = 11; 2 technical repeats) compared with the control group (n = 11; 2 technical repeats) (P = 0.095). Unpaired t test was used for statistical analysis. Data represent mean ± SD.

