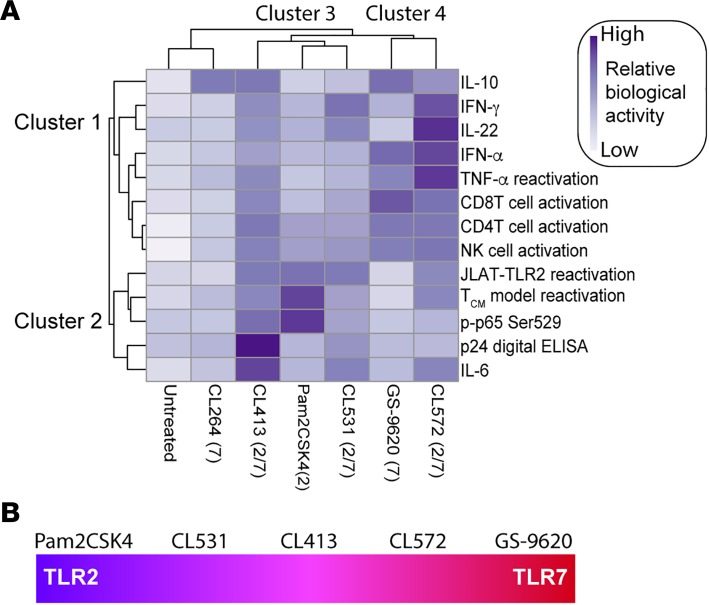
Figure 6. Heatmap visualization of the ability of each TLR agonist to have different biological activities.
(A) The clustergram at the left of the heatmap reflects the relationships between the different biological activities across compounds. The clustergram at the top of the heatmap reflects the relationship between each TLR agonist across the different biological activities. Clustergrams were created using ClustVis. Dark blue cells in the heatmap reflect biological activity, whereas light blue cells indicate that the compounds do not have biological activity. (B) CL413 is the dual TLR that exhibits the best TLR2 and TLR7 agonist activity.

