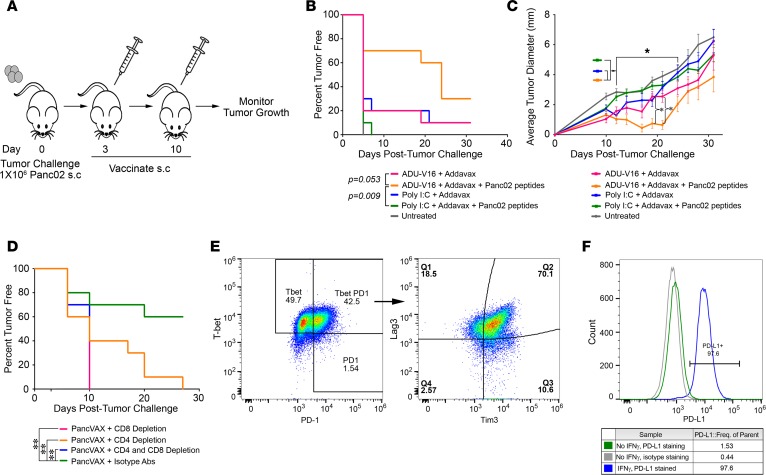
Figure 3. Tumor-specific peptides in combination with ADU-V16 and AddaVax result in tumor regression and a survival benefit.
(A) Schematic representation of the vaccination schedule. Mice were challenged with 106 Panc02 tumor cells in the right hind leg on day 0, followed by vaccination, at days 3 and 10, with Panc02 peptides together with AddaVax (50 μg) and either Poly I:C (10 μg) or ADU-V16 (5 μg). Mice were euthanized when the tumors reached 10 × 10 mm or when tumors began to impair mobility or ulcerate. (B) Kaplan-Meier curves showing the percentage of mice that were tumor free. Statistics by log-rank Mantel-Cox test. (C) Tumor growth was measured every 3 to 4 days with calipers until tumors reached 10 × 10 mm. *P < 0.001, Student’s t test, corrected for multiple comparisons. n = 10 mice in each treated group, 5 mice in untreated group for both B and C. (D) Mice were similarly vaccinated as in A and were either depleted of CD4+ or CD8+ T cells or both with the respective antibodies (see Methods). Kaplan-Meier curves showing the percentage of mice that were tumor free. n = 10 mice per group at outset. Statistics by log-rank Mantel-Cox test. (E) Flow cytometry for cell surface exhaustion markers of tumor-infiltrating lymphocytes from mice treated with PancVAX, ADU-V16, and AddaVax. Live, CD3+CD8+Tbet+PD1+ T cells were gated and graphed for Tim3 and Lag3 expression (representative data shown). (F) Panc02 cells were cultured in the presence or absence of 10 ng/ml mouse IFN-γ for 72 hours. Cells were stained with anti-mouse PD-L1 or control isotype antibody and analyzed by flow cytometry (shown as representative traces).

