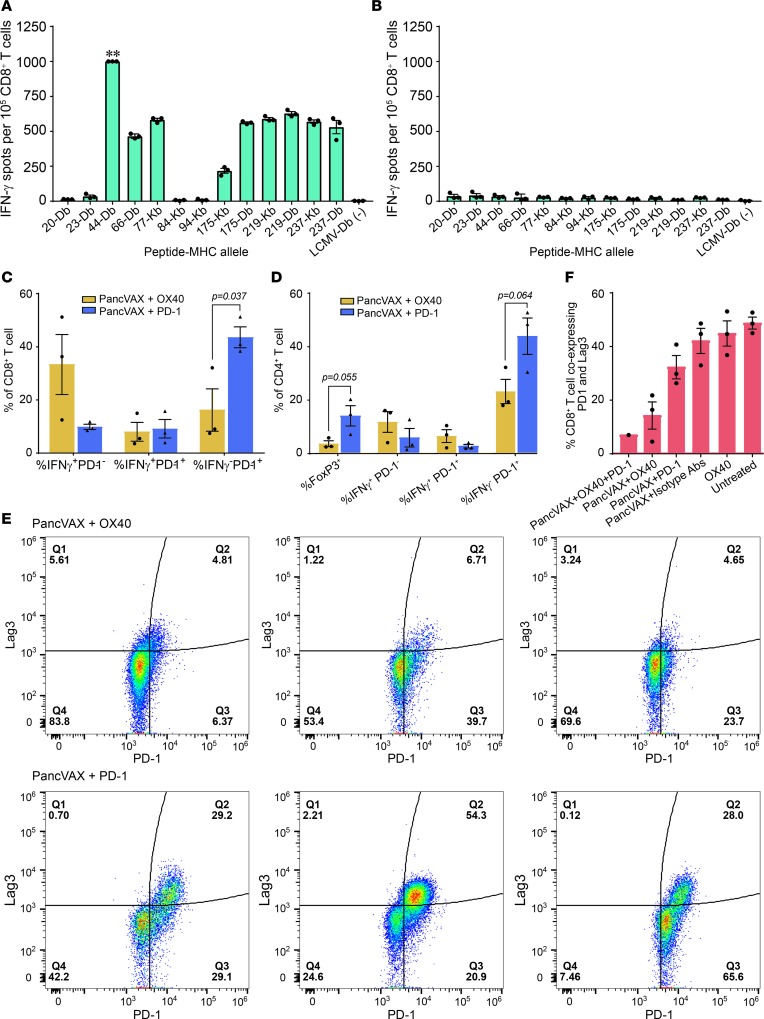
Figure 5. Tumor-infiltrating T cells in mice treated with PancVAX and checkpoint modulators.
ELISPOT assays showing IFN-γ–producing CD8+ T cells from tumors isolated from mice receiving triple therapy (PancVAX + anti–PD-1 + OX40). ** indicates too many spots to count (A) or isotype control is shown in (B). Isolated CD8+ T cells were incubated with T2-Db or T2-Kb antigen-presenting cells (APCs) that were pulsed with individual PancVAX peptides (as shown). Tumors from 10 mice per group were pooled; technical replicates are shown. (C) Flow cytometry showing the percentage of CD8+ T cells expressing IFN-γ, IFN-γ with PD-1, or PD-1 alone. (D) Flow cytometry showing the percentage of CD4+ T cells expressing FoxP3, IFN-γ, IFN-γ and PD-1, or PD-1 alone. Each bar represents cells isolated from a single tumor for C and D. Statistics by unpaired Student’s t test. (E) Tumor-infiltrating T cells were harvested and stained for the surface expression of the exhaustion markers Lag3 and PD-1 (flow cytometry) (representative traces from single tumor). (F) Flow cytometry showing the percentage of CD8+ T cells coexpressing PD-1 and Lag3 following treatment of mice with PancVAX, ADU-V16, AddaVax, low-dose OX40 (50 μg), and/or anti–PD-1 (100 μg). Relevant isotype antibodies were used as controls. For E and F, cells were gated by size for T cells and then gated for live CD8+ T cells. Statistics by Student’s t test, corrected for Bonferroni. P < 0.05; n = 3 mice per group (except the triple treatment as the other 2 tumors were cleared); individual mice and mean ± SEM are shown.

