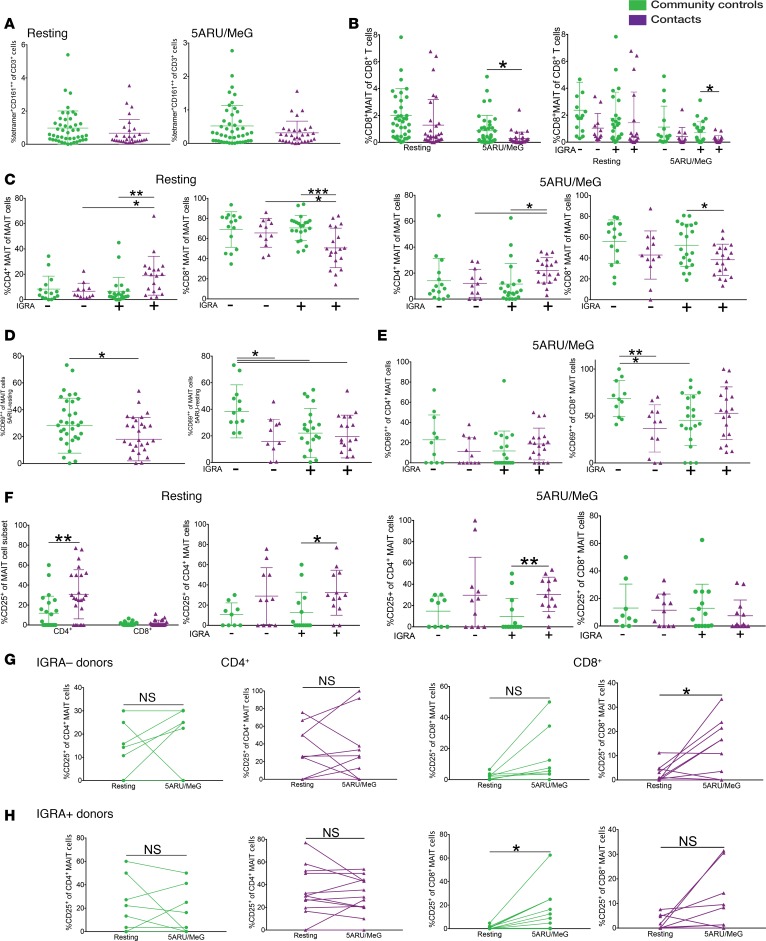
Figure 3. MAIT cell subsets respond to early Mycobacterium tuberculosis infection.
(A) MAIT cell abundance among T cells after 15 hours of rest (left) or 5-A-RU/MeG activation (right) in community controls (green) and household contacts (purple). Color coding applies to all panels. Data in all panels represent mean ± SD. (B) CD8+ MAIT cell abundance within the CD8+ T cell subset at rest or after 5-A-RU/MeG (left) with IGRA stratification (right). (C) CD4+ and CD8+ MAIT cell relative abundance among MAIT cells stratified by IGRA status at rest (left) or after 5-A-RU/MeG activation (right). (D) Total MAIT cell activation measured as the difference of CD69 staining in the 5-A-RU/MeG and resting conditions (left) with IGRA stratification (right). (E) CD69 staining in CD4+ (left) and CD8+ (right) MAIT cells after 5-A-RU/MeG. (F) Activation measured by CD25 staining in CD4+ and CD8+ MAIT cells with IGRA stratification at rest (left) or after 5-A-RU/MeG (right). A–F were analyzed by 2-tailed unpaired t test. (G and H) CD25 staining in CD4+ MAIT (left) and CD8+ MAIT (right) in IGRA– (G) and IGRA+ (H) donors analyzed by 2-tailed paired t test. *P < 0.05, **P < 0.005, ***P < 0.0005. IGRA, IFNγ release assay; 5-A-RU, 5-amino-6-(D-ribitylamino)uracil; MeG, methylglyoxal.

