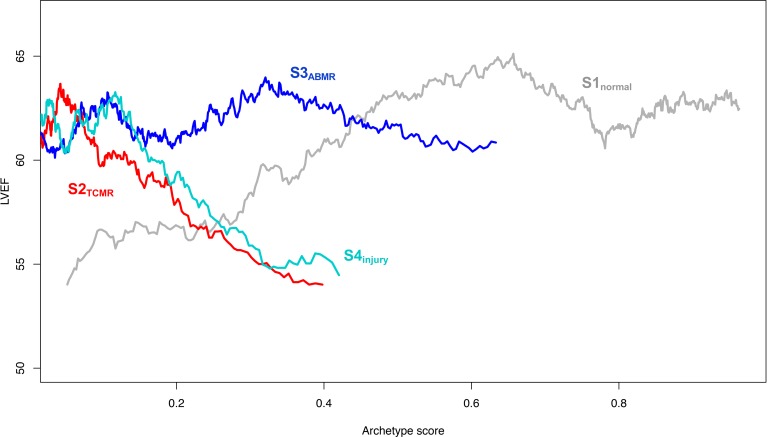
Figure 4. Running average of LVEF versus archetype scores.
For each of the 4 archetype scores, the 606 biopsies with available LVEF data were sorted by the archetype score being plotted. A sliding window of size n = 85 biopsies was then used to plot the mean LVEF versus mean archetype score. For example, the first data point on the left on the S1normal line corresponds to the mean LVEF and mean S1normal of the first through 85th biopsies (sorted in ascending order of the 606 S1normal scores), the second point to the second through 86th biopsies, etc. The lines have different x-axis ranges because, for example, the highest 85 S2TCMR scores are approximately 0.4, while the highest 85 scores for each of S1normal, S3ABMR, and S4injury are larger.

