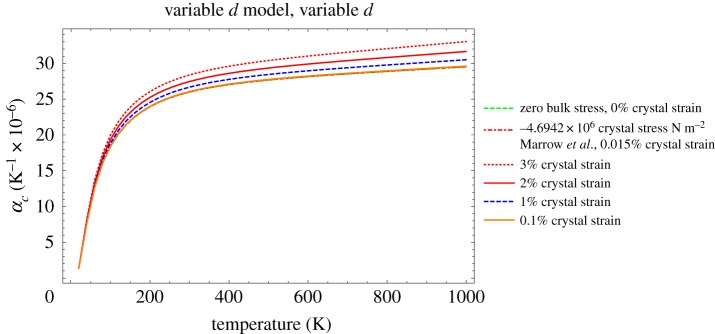
Figure 10.
Prediction of αc, taking account of the change in d-spacing, with increasing temperature and differing amounts of crystal strain, note that the 0%, 0.015% (measured by Marrow et al. [44]) and 0.1% curves overlie each other. (Online version in colour.)

