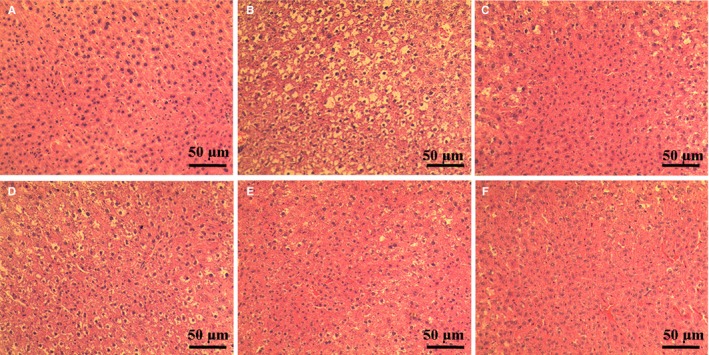
Figure 5.

Effects of total saponins on pathological changes in the liver of type 2 diabtetic db/db mice (n = 3) (HE staining, magnification: ×200). (A) The normal mice; (B) type 2 diabetes model db/db group; (C) 200 mg/kg metformin group; (D) 30 mg/kg TSS group; (E) 60 mg/kg TSS group; (F) 120 mg/kg TSS group
