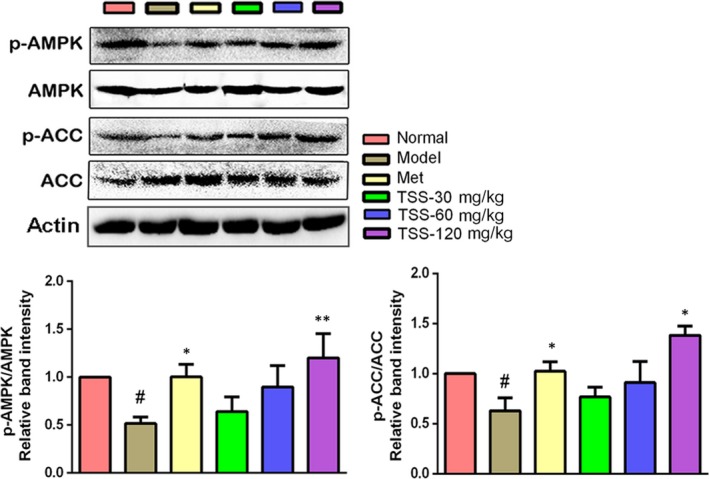
Figure 8.

Effects of total saponins on phosphorylated AMPK and ACC in liver tissues of type 2 diabetic db/db mice (n = 3). The protein expressions are shown as the mean grey scale of the matching bands in the bar graph. # P < 0.05 in contrast to the normal group; *P < 0.05 in contrast to the model group; and **P < 0.01 in contrast to the model group
