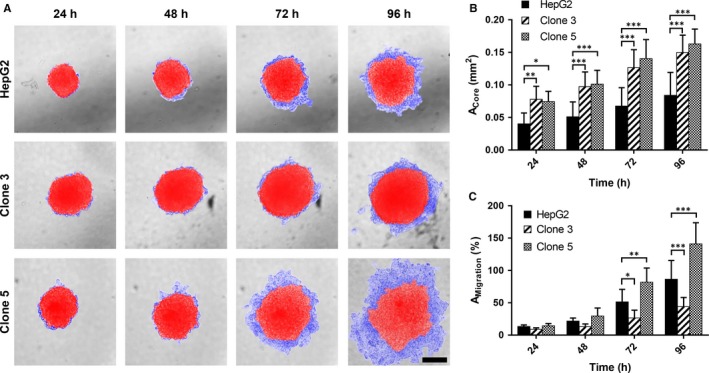
Figure 3.

Spheroid growth and migratory potential of HepG2, clone 3 and clone 5 cells in vitro. A, Representative light microscopy images of the growth of HepG2, clone 3 and clone 5 spheroids and cell migration out of these spheroids after 24, 48, 72 and 96 h of incubation. Spheroid core area—red. Spheroid migration area—blue. Scale—200 μm. B, Time‐dependent spheroid growth as determined by measuring the spheroids’ core size after 24, 48, 72 and 96 h of incubation. C, Relative migration (AM igration) of HepG2, clone 3 and clone 5 cells from spheroids as assessed by determination of the migration area with respect to the corresponding spheroid core area (AC ore). Values represent means ± SD and statistical analysis was performed with two‐way ANOVA, followed by Dunnett's multiple comparisons test (HepG2: n = 6, clone 3: n = 9, clone 5: n = 12). *P < 0.05, **P < 0.01, ***P < 0.001
