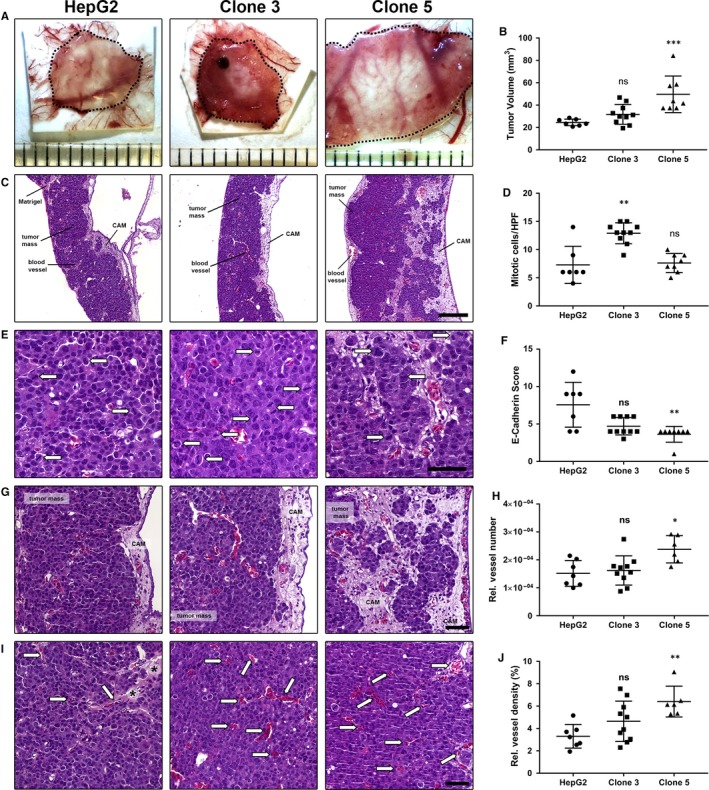
Figure 5.

In vivo growth and aggressiveness of HepG2, clone 3 and clone 5 cells in the chorioallantoic membrane (CAM) xenograft assay. A, Ex ovo images of micro‐tumours harvested 5 days post‐engraftment on the CAM of fertilized chicken eggs. Dotted lines indicate tumour margins. Ruler segments define a length of 1 mm. B, Tumour volume of micro‐tumours after 5 days of incubation (HepG2: n = 7, clone 3: n = 10, clone 5: n = 8). C, Overview of HE stained micro‐tumour sections, Scale—200 μm. D, Proliferation of CAM‐micro‐tumours as determined by the average number of mitotic figures per HPF (HepG2: n = 7, clone 3: n = 10, clone 5: n = 8). E, Exemplary images of mitotic figures (arrows) as detected in HepG2, clone 3 and clone 5 micro‐tumours by HE staining. Scale—50 μm. F, E‐Cadherin immunoscore of HepG2, clone 3 and clone 5 micro‐tumours (HepG2: n = 7, clone 3: n = 10, clone 5: n = 8) as determined by immunohistochemical staining. G, Representative images of the invasion front in HE stained tissue section of HepG2, clone 3 and clone 5 CAM micro‐tumours. Scale—50 μm. H, Relative vessel number in CAM micro‐tumours formed by HepG2, clone 3 and clone 5 cells (HepG2: n = 7, clone 3: n = 10, clone 5: n = 6). I, Representative images of the vascularization in HepG2, clone 3 and clone 5 CAM micro‐tumours as seen in HE stained tissue sections. Scale—50 μm. Arrows—blood vessels filled with nucleated chick embryo erythrocytes. Asterisks—residual Matrigel. J, Relative vessel density of CAM micro‐tumours formed by HepG2, clone 3 and clone 5 cells (HepG2: n = 7, clone 3: n = 10, clone 5: n = 6). Data are presented with means ± SD and statistical analysis was performed using one‐way ANOVA, followed by Dunn's multiple comparisons test (Kruskal‐Wallis test). ns, not significant; *P < 0.05, **P < 0.01, ***P < 0.001
