Figure 6.

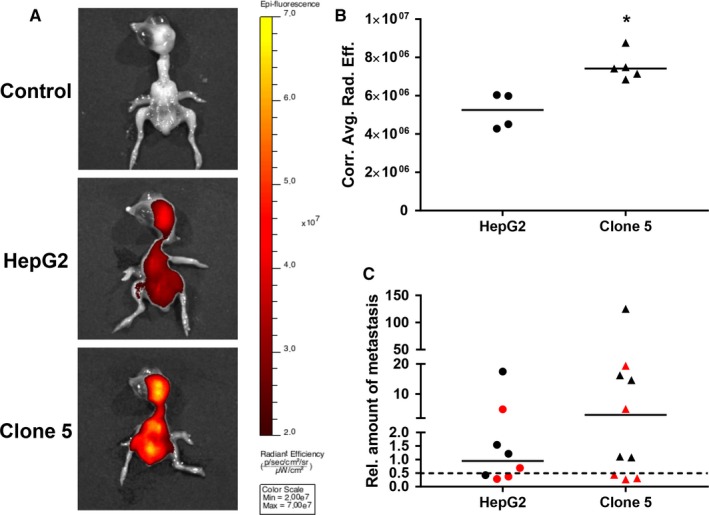
Fluorescence imaging of chicken embryos 5 days after engraftment of deep‐red fluorescence labelled HepG2 and clone 5 cell pellets to evaluate metastatic potential. A, Representative images of chicken embryos (top: control/background—n = 3; middle: HepG2—n = 4; bottom: clone 5—n = 5) with colour‐coded overlays of the radiant efficiency as determined by fluorescence imaging with a range from black to yellow according to the given colour bar (IVIS Spectrum, Perkin Elmer). B, Quantified average radiant efficiencies as detected by fluorescence imaging in chicken embryos after engraftment of parental HepG2 (n = 4) and clone 5 (n = 5) cells. C, Relative amounts of metastasis in the liver (black) and brain (red) of chicken embryos as determined by Alu real‐time PCR 5 days after engraftment of the HepG2 and clone 5 cells. A value of 1 indicates an amount of 0.01 ng of human DNA. The dotted line represents the cut‐off for metastasis detection, which was defined by the sensitivity limit of the Alu PCR method. Medians of the data are presented as lines in the graphs and statistical analysis was performed with the Mann‐Whitney test. *P < 0.05.
