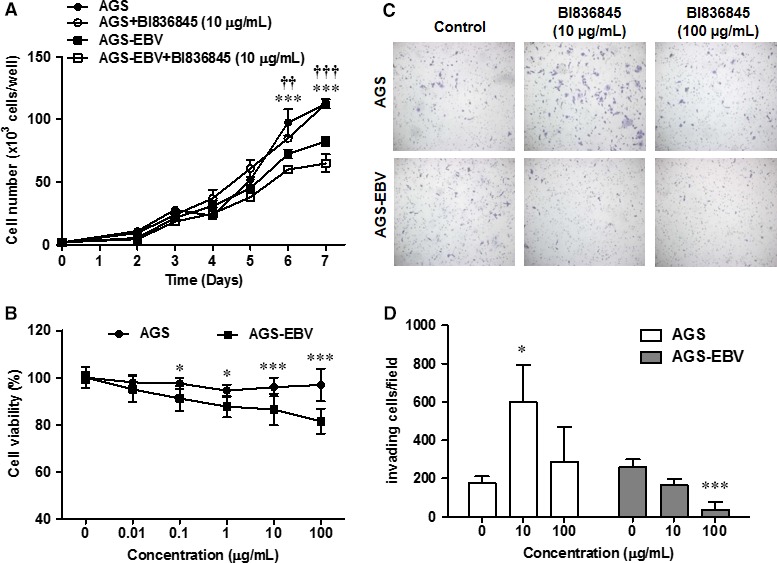
Figure 2.

Phenotypic changes in AGS and AGS‐EBV cells after treatment with BI836845. (A) Proliferation of AGS and AGS‐EBV cells was determined with Trypan Blue exclusion assays for 7 days. (B) BI836845 sensitivity was measured using CCK‐8 assays after 72 h. (C) Representative crystal violet staining images of AGS and AGS‐EBV cells. (D) Invasive cells were counted in eight fields of three different wells. Results were normalized to control and are shown as mean ± SD Statistical significance is represented in relation to control: AGS versus AGS‐EBV, *P < 0.05, ***P < 0.001; AGS‐EBV versus AGS‐EBV treatment, †† P < 0.01, ††† P < 0.001
