Figure 5.

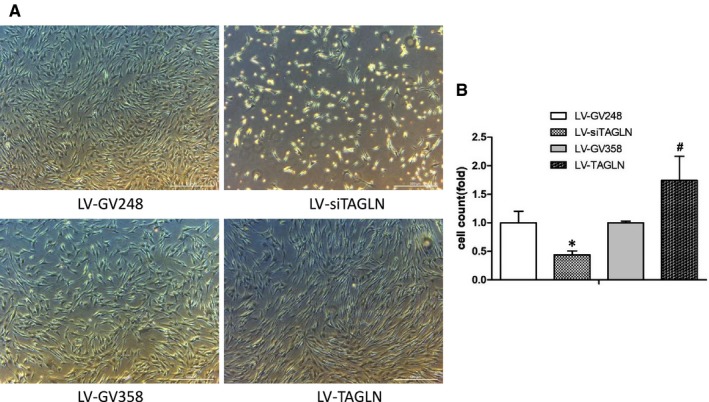
HPASMC proliferation in cell counts. A, cell proliferation observed under microscope (50X) after treatment. B, cell counts with haemocytometer.*: LV‐siTAGLN vs LV‐GV248, P < 0.05. #: LV‐TAGLN vs LV‐GV358, P < 0.05

HPASMC proliferation in cell counts. A, cell proliferation observed under microscope (50X) after treatment. B, cell counts with haemocytometer.*: LV‐siTAGLN vs LV‐GV248, P < 0.05. #: LV‐TAGLN vs LV‐GV358, P < 0.05