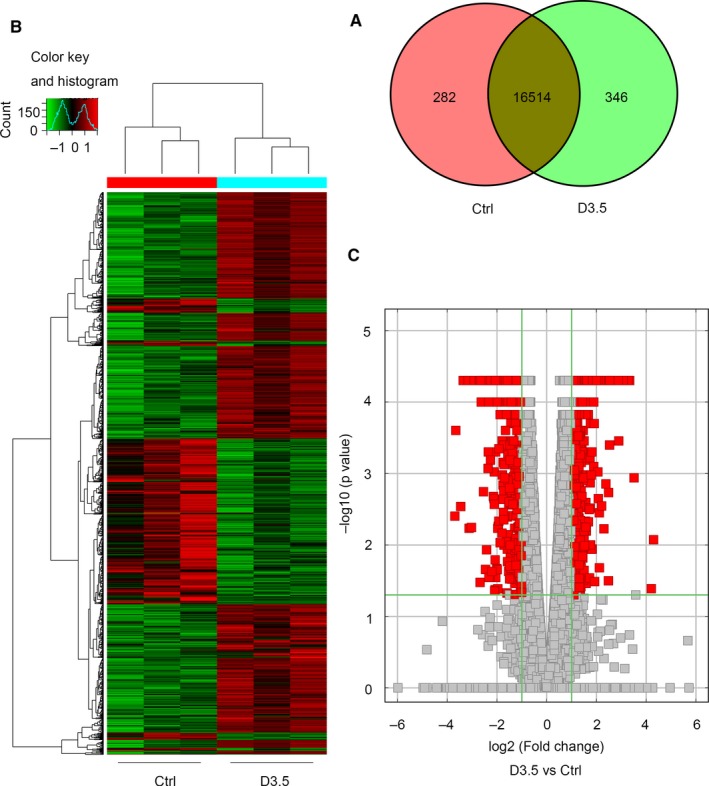
Figure 2.

The expression profiling changes of mRNAs in control group and irradiated group. A, Venn diagram showing the number of overlapping mRNAs in irradiated and control groups. B, Heat map of mRNAs showing hierarchical clustering of altered mRNAs in irradiated mice when compared with controls. Red represents up‐regulation and green represents down‐regulation. C, Volcano Plot indicating up‐ and downregulated mRNAs in irradiated mice when compared with controls
