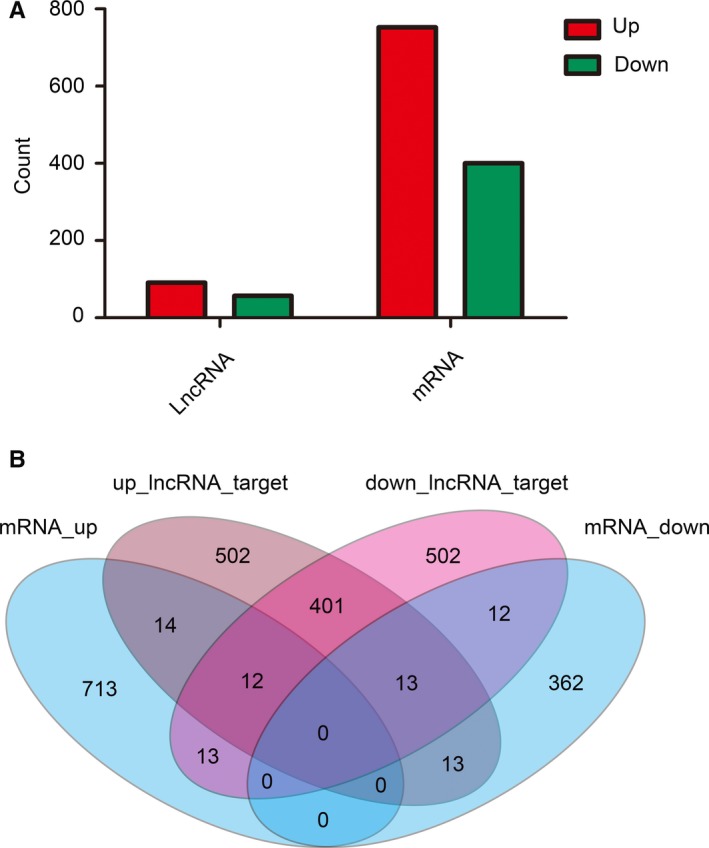
Figure 3.

Number of relative lncRNAs and mRNAs in irradiated mice when compared with controls. A, Histogram showing the number of up‐ and downregulated lncRNAs and mRNAs in irradiated mice. B, Venn diagram showing the overlapping number of targeted mRNAs in up‐regulated lncRNAs, targeted mRNA in down‐regulated lncRNAs, up‐regulated mRNAs, and down‐regulated mRNAs
