
Figure 3.
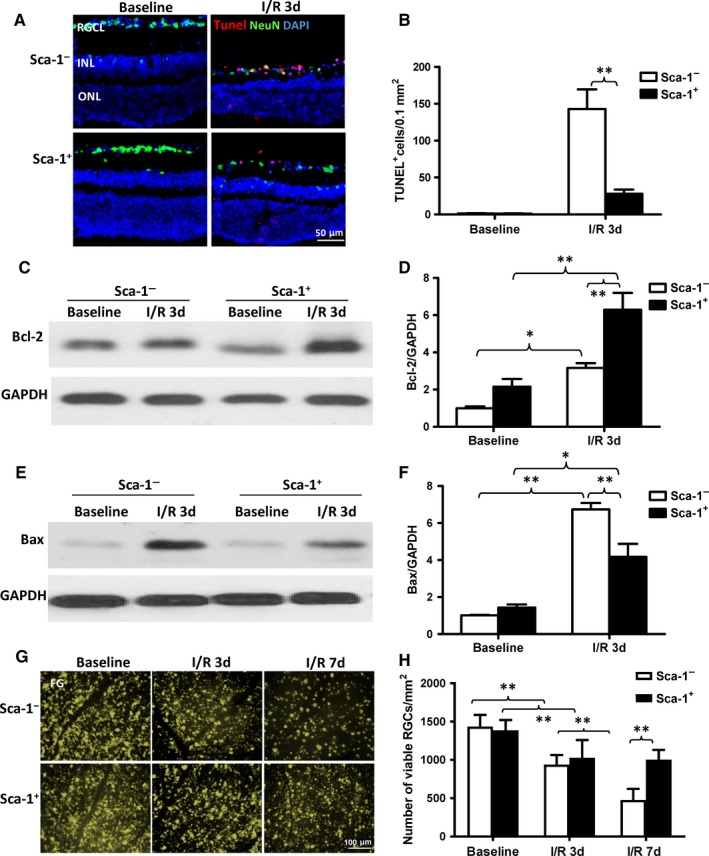
Homed BM Sca‐1+ cells rescued the host retina from cellular apoptosis. Cellular apoptosis was evaluated 3 days post‐ischaemia‐reperfusion (I/R) injury using Tunel staining. (A) Representative images of apoptotic cells (Tunel+, red) and (B) quantification of Tunel+ cells in Sca‐1+ and Sca‐1− chimaeras with or without I/R injury (n = 4/group). Bcl‐2 and Bax protein expression was evaluated by Western blot. (C) Representative Western blot image and (D) quantification of Bcl‐2 protein expression in Sca‐1+ and Sca‐1− chimaeras with or without I/R injury. GAPDH was used as a loading control (n = 4/group). (E) Representative Western blot image and (F) quantification of Bax protein expression in chimaeric mice with or without I/R injury. GAPDH used as a loading control (n = 3/group). (G) Representative images and (H) quantification of viable RGCs using FluoroGold (FG)‐labelling showed that the number of RGCs decreased at 3 and 7 days after reperfusion. However, the number of RGCs that survived was significantly greater in the retinas of Sca‐1+ than Sca‐1− chimaeric mice at 3 and 7 days after I/R injury. RGC: retinal ganglion cell; RGCL: retinal ganglion cell layer; INL: inner nuclear layer; ONL: outer nuclear layer. Data analysis used two‐way ANOVA followed by Bonferroni post‐hoc tests for multiple comparisons (B, D, F and H). Data shown are mean ± SEM. **P < 0.01, *P < 0.05