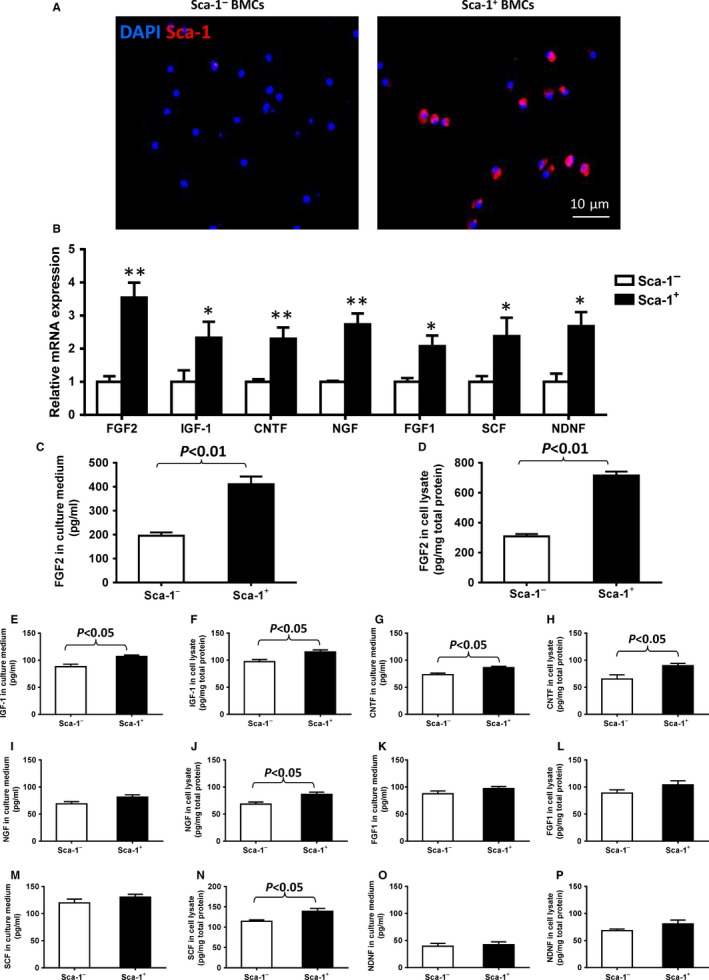
Figure 4.

Differential expression profile of growth factors between BM‐derived Sca‐1+ and Sca‐1− subset of cells. (A) Immunolabelling confirmed the phenotype of bone marrow (BM)‐derived Sca‐1+ and Sca‐1− cells. (B) The expression profiles of growth factors were determined by RT‐qPCR. The mRNA levels of FGF2 (fibroblast growth factor 2), IGF‐1 (insulin‐like growth factor 1), CNTF (ciliary neurotrophic factor), NGF (nerve growth factor), FGF1 (fibroblast growth factor 1), SCF (stem cell factor) and NDNF (neuron‐derived neurotrophic factor) were significantly higher in Sca‐1+ than Sca‐1− cells. Amongst these growth factors, the mRNA level of FGF2 increased most dramatically in the BM Sca‐1+ cells relative to the Sca‐1− cells. (C‐P) After 48 hours of culture, FGF2, IGF‐1, CNTF, NGF, FGF1, SCF, and NDNF protein levels in the culture medium and cell lysate were determined by ELISA. FGF2 protein level was significantly greater in the medium and cell lysate of BM Sca‐1+ than Sca‐1− cells (n = 4/group). Data analysis used un‐paired t test. Data shown are mean ± SEM. *P < 0.05, **P < 0.01
