Figure 3.

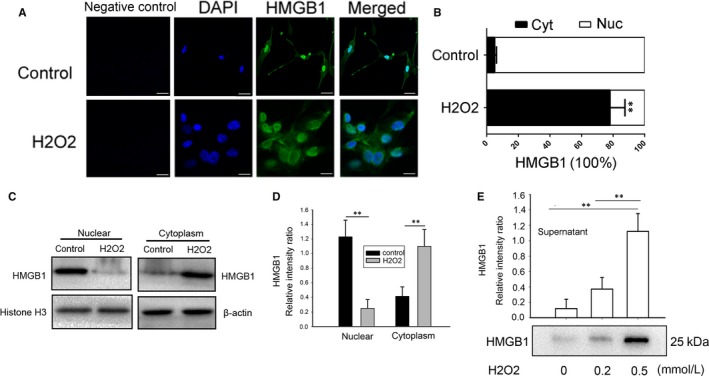
Effects of H2O2 on HMGB1 cytoplasmic translocation and release from NHEMs. (A) NHEMs were stimulated with 0.5 mM H2O2 for 12 hours and cells were immunostained with an HMGB1‐specific antibody (green) and DAPI (blue). (B) The mean nuclear (Nuc) and cytosolic (Cyt) HMGB1 staining intensity per cell was determined by cytometric imaging analysis as described in the Materials and Methods. (C, D) NHEM were stimulated with 0.5 mM H2O2 for 12 hours, HMGB1 content in the cytoplasmic and nuclear fraction was determined by western blotting analysis. Equal loading of samples was confirmed by western blotting analysis of each fraction with antibodies specific for a nuclear (Histone H3) or cytoplasmic (β‐actin) protein. (E) HMGB1 levels in the culture medium 12 hours after stimulation with H2O2 at the indicated doses. HMGB1 levels in the supernatant were determined by the relative optical intensity of the immunoreactive bands on western blots. Scale bar = 10 μm. Data are from three independent experiments. **P < 0.01
