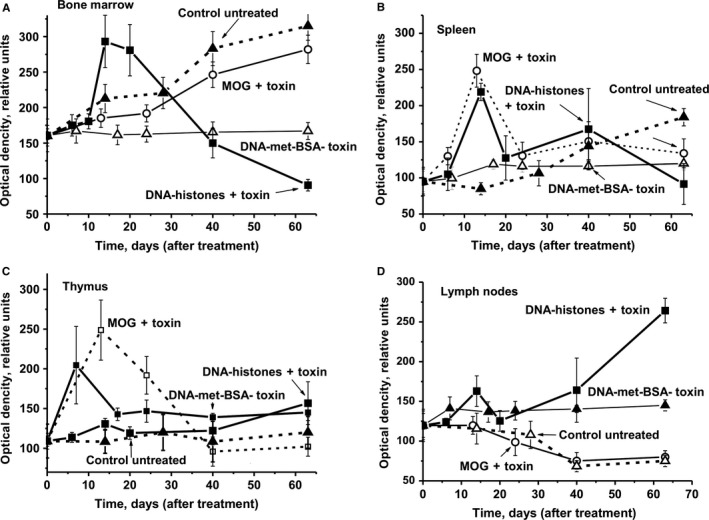
Figure 6.

The average over time changes in the optical density reflecting the relative amount of lymphocytes in bone marrow (A), spleen (B), thymus (C) and lymph nodes (D) are shown for untreated mice, as well as after their treatment with DNA–histone + toxin, a complex of DNA with methylated BSA (DNA‐met‐BSA) without toxin and MOG + toxin. Immunogens used are shown on Panels A‐D. The error in the optical density estimation for each mouse for all groups (with seven mice per group) from three independent experiments did not exceed 7%‐10%
