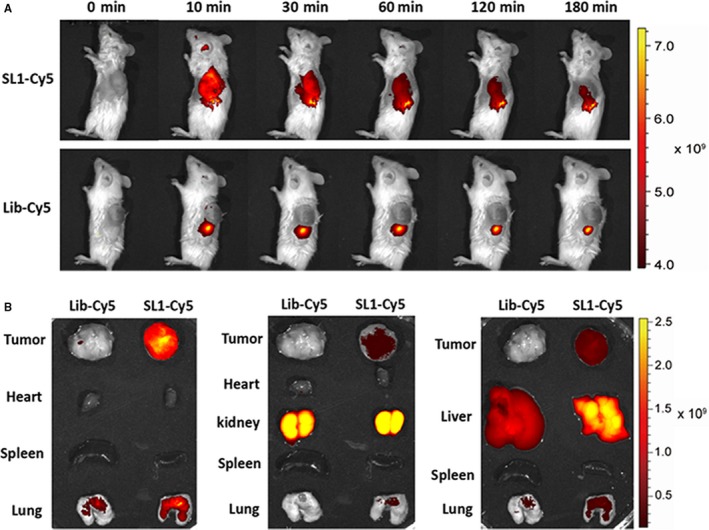
Figure 3.

In vivo and ex vivo biodistribution of SL1 in a xenograft mouse model of MM. A, Upper: time‐lapse in vivo fluorescence imaging after injection of Cy5‐labelled SL1. Lower: time‐lapse in vivo fluorescence imaging after injection of a Cy5‐labelled library. Representative images are shown (mice, n = 3). B, Ex vivo fluorescence imaging of dissected organs and tumour tissues at 1 hour after injection of Cy5‐labelled SL1 or a Cy‐5‐labelled control library. Representative images are shown (mice, n = 3)
