
Figure 7.
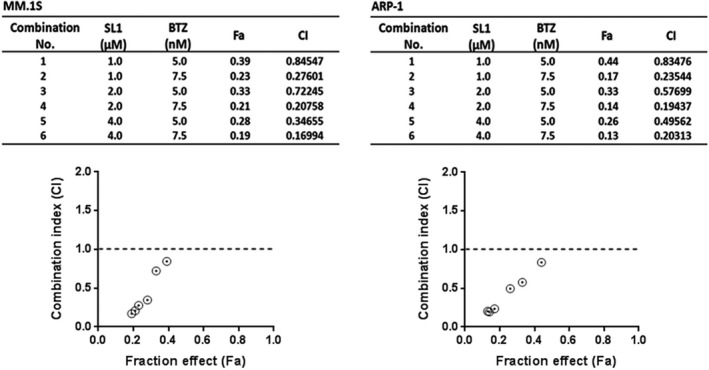
Evaluation of the synergistic effects of SL1 and BTZ in MM cells. A, MM.1S and ARP‐1 cells were treated with SL1 alone, BTZ alone or a combination of SL1 plus BTZ as indicated for 24 hours and were then assessed for cell viability performed with a CCK‐8 assay. Combination index (Cl) corresponding to the specific data points on the table were analysed by the CompuSyn software for non‐constant drug ratio and plotted on the graph against fraction effect (Fa) to evaluate SL1‐BTZ synergy. A Cl <1.0 indicates synergism. 0.1‐0.3, strong synergism; 0.3‐0.7, synergism; 0.7‐0.85, moderate synergism; 0.85‐0.9, slight synergism