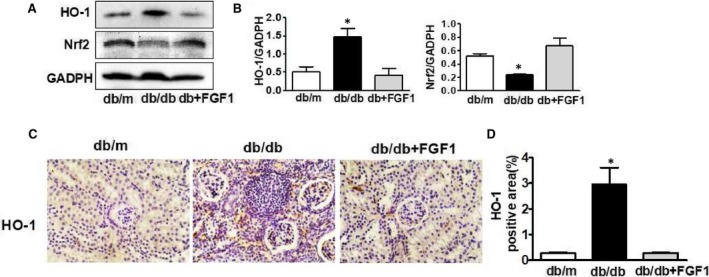
Figure 4.

The effect of Nrf2/HO‐1 signalling during FGF1administration for diabetes‐induced oxidative stress and nitrosative stress in kidney. A and B, The protein expression of HO‐1 and Nrf2 of kidney from db/m, db/db and db+FGF1 group; C and D, Immunohistochemical staining of HO‐1of kidney from db/m, db/db and db+FGF1 group (scale bars = 30 μm). All data are presented as the mean ± SEM, n = 3. *P < 0.05 vs the db/m group and db+FGF1 group
