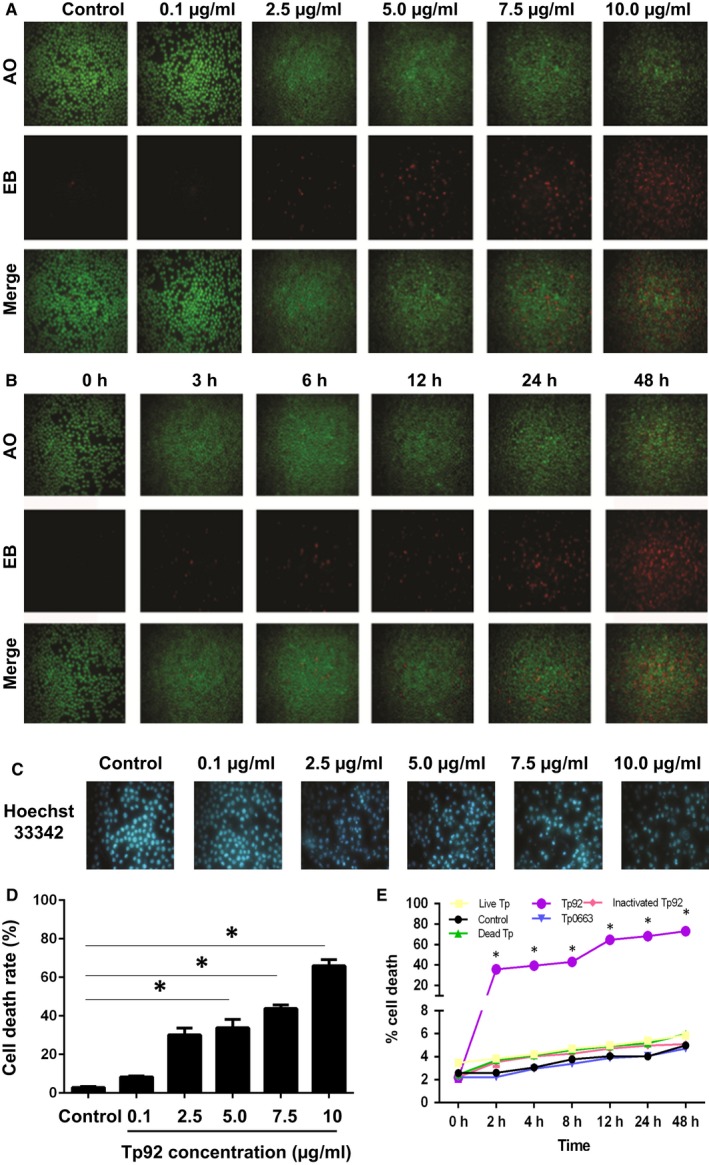
Figure 1.

Effect of the Tp92 protein on THP‐1 cell death. A and B, Effect of different (A) concentrations or (B) durations of Tp92 treatment on the integrity of THP‐1 cell membranes. The cells were treated with (A) 0, 0.1, 2.5, 5.0, 7.5 or 10.0 μg/mL Tp92 for 12 hours or (B) 5.0 μg/mL Tp92 for 0, 3, 6, 12, 24 or 48 hours. AO/EB staining was performed, and the cells were observed under a fluorescence microscope. Red indicates cells with damaged membrane, while green indicates intact cells. C, Effect of different concentrations of the Tp92 protein on the nuclei of THP‐1 cells. The cells were stimulated with 0, 0.1, 2.5, 5.0, 7.5 or 10.0 μg/mL Tp92 for 12 hours, and the nuclei were stained with Hoechst33342 dye and observed under a fluorescence microscope. D and E, Effect of different (D) concentrations or (E) durations of Tp92 treatment on the total death rates of THP‐1 cells. The cells were treated with (D) 0, 0.1, 2.5, 5.0, 7.5 or 10.0 μg/mL Tp92 for 12 hours or (E) 1 × 10³ live Tp (Treponema pallidum), 1 × 10³ dead Tp, 5.0 μg/mL Tp0663 (T. pallidum outer membrane protein), 5.0 μg/mL Tp92 and 5.0 μg/mL inactivated Tp92 (heat inactivation) for 0, 2, 4, 8, 12, 24 or 48 hours. The CCK‐8 assay was used to determine the total death rates of the THP‐1 cells. Data are expressed as the means ± standard deviations of three replicates. *P < 0.05 compared with the control
