
Figure 1.
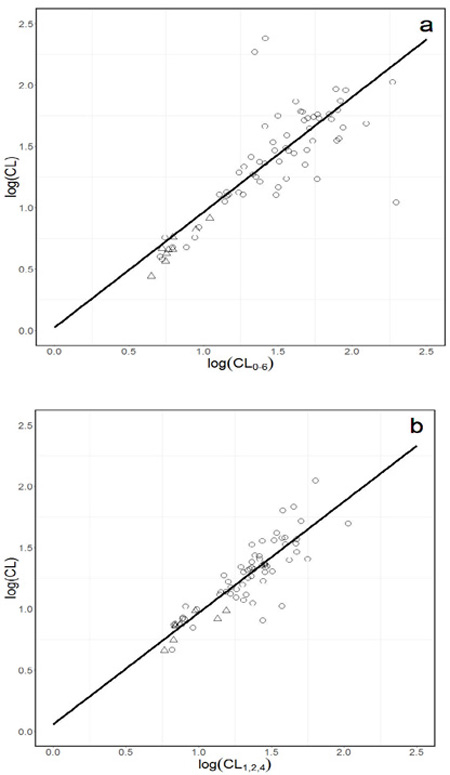
Representative full concentration-time log(CL) versus limited sampling log(CL) plots for a. NCA model of log(CL) = 0.023 + 0.94 × log(CL0–6) and b. Population PK model of log(CL) = 0.057 + 0.91 × log(CL1,2,4). Open circles represent 1 or 2 active CYP2C19 alleles and open triangles represent 0 active CYP2C19 alleles.