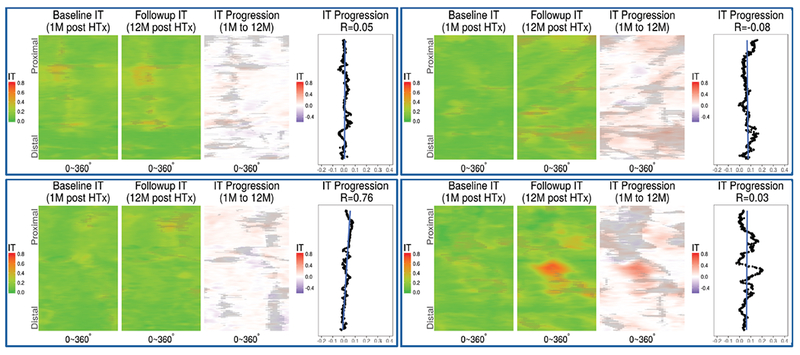
Figure 3:

Feature carpets of intimal thickness (IT) and thickening. Mutually registered intimal thickness at 1 and 12 months (M), and their differences shown color coded on an axially unwrapped vessel wall. Shadowed areas represent non-measurable exclusion regions caused by guidewire shadow, residual blood, intimal layer thickness exceeding OCT penetration depth, etc. Rightmost chart in each panel shows frame-based IT progression, blue straight line shows a linear fit of frame-based IT progression along the co-registered vessel portion.
