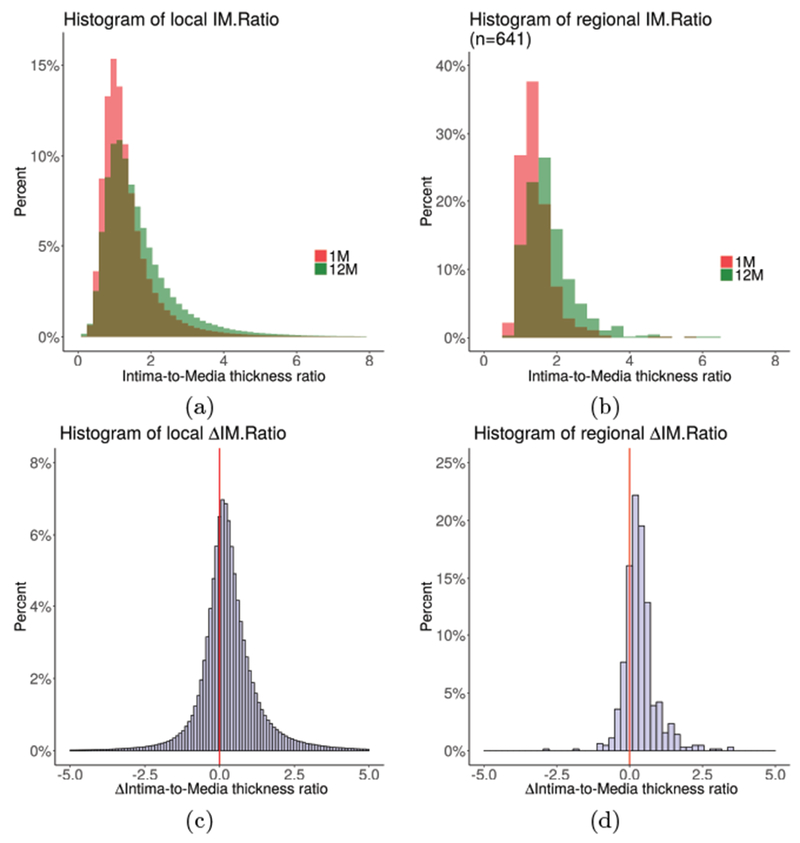
Figure 6:

Distribution of local and regional (3 mm long vessel segments) intimal thickness across the cohort at 1-month and 12-month (80,600 local and 13 regional measurements per pullback on average). (a) Histograms of local IMratio. (b) Histograms of regional IMratio. (c) Histogram of local ΔIMratio. (d) Histogram of regional ΔIMratio. Note the clear indication of increased IMratio between 1M and 12M, both locally and regionally.
