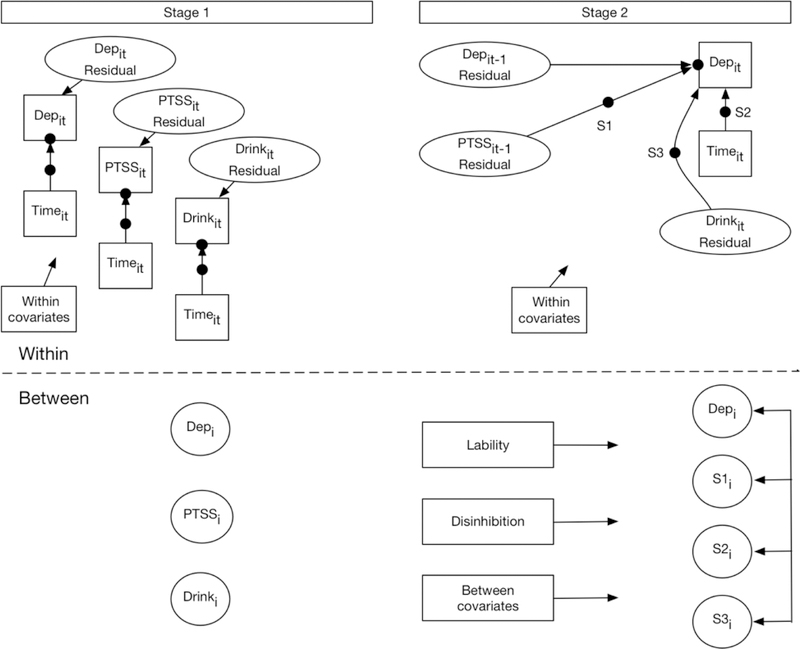
Figure 1.
Conceptual diagram of the two-stage data analytic approach. The dependence syndrome (Dep.) model is used for illustration. Solid dots are random intercepts and slopes. The “i” subscript stands for individual. Time (t) is days since initiating study. Hence, it-1 is a 1-day lagged effect for person i. The path from Depit-1 → Depit is the autoregressive effect. For clarity, some elements are omitted (e.g., exposure, time2, day of the week indicators, interactions between L2 variables and L1 variables with fixed slopes, etc. ).

