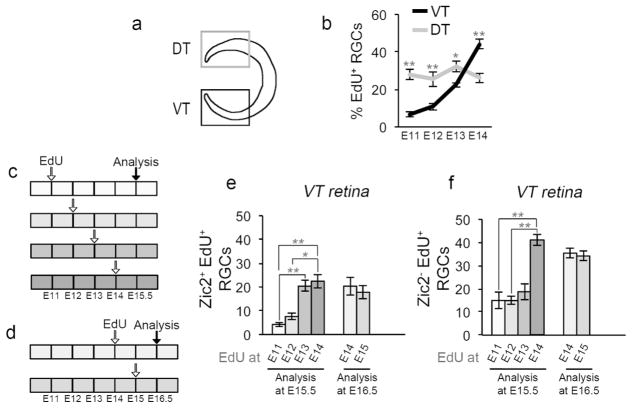
Figure 2. Ipsilateral and contralateral RGC are generated at distinct embryonic times.
a: Cartoon depicting ventrotemporal (VT) and dorsotemporal (DT) regions of retina. Zic2+ ipsilateral RGCs (iRGCs) reside in VT retina exclusively, whereas Zic2− contralateral RGCs (cRGCs) localize to the entire retina, with DT retina comprised of cRGCs only. Islet1 labels all postmitotic RGCs throughout the retina.
b: Quantification of RGC genesis from E11 to E14, in VT and DT retina. EdU was injected into pregnant dams at E11, 12, 13, or 14 as in Figure 1 (see also Figure 2c). Frontal retinal sections were immunostained with antibodies to Islet1 and processed for EdU detection at E15.5. Coincidence of Islet1 and EdU signal indicates that an RGC was born at the time of the EdU injection. RGC production was calculated as the percentage of Islet1+EdU+ double-labeled RGCs, divided by the total number of Islet1+ RGCs. Whereas the production of RGCs in DT retina is constant from E11 to E14, RGC genesis in VT retina is low at E11–12 and increases at E13.
n for VT: n=6 at E11, 9 at E12, 6 at E13, and 7 at E14. n for DT: n=6 for E11, 4 for E12, 6 for E13, and 4 for E14.
c: Timeline of 5-ethynyl-2′-deoxyuridine (EdU) injections at E11, 12, 13, or 14, and sacrifice at E15.5. Each box represents 12 hours, and each empty arrow represents three injections of EdU (10 am, 2 pm, 6 pm). The black arrow represents the time of analysis.
d: Timeline of EdU injections at E14 or 15 and sacrifice at E16.5. Each box represents 12 hours, and each empty arrow represents three injections of EdU (10 am, 2 pm, 6 pm). The black arrow represents the time of analysis.
e: Bar graph comparing the number of ipsilateral Zic2+ RGCs labeled with EdU (identified as Zic2+/Islet1+/EdU+ triple-labeled cells) in VT retina in mice injected with EdU at E11, 12, 13 or 14 and analyzed at E15.5 (left bars), or injected with EdU at E14 or 15 and analyzed at E16.5 (right bars). Ipsilateral RGC neurogenesis in VT retina increases at E13, and remains constant throughout E15. n for EdU until E15.5: n=6 at E11, 9 at E12, 6 at E13, and 7 at E14.
n for EdU until E16.5: n=6 at E14, and 4 at E15.
f: Bar graph comparing the number of Zic2− (contralateral) RGCs labeled with EdU (identified as Zic2−/Islet1+/EdU+ triple-labeled cells) in VT retina in mice injected with EdU at E11, 12, 13 or 14 and analyzed at E15.5 (left bars), or injected with EdU at E14 or 15 and analyzed at E16.5 (right bars). Contralateral RGC neurogenesis in VT retina increases at E14, one day after the surge in iRGC production, and remains constant until at least E15.5. Of note, the majority of Zic2− cRGCs labeled with EdU at E14.5 do not express Zic2 at E15.5 (left bars) or at E16.5 (right bars), suggesting that these RGCs do not upregulate the ipsilateral marker Zic2 and are in all likelihood contralateral.
n for EdU until E15.5: n=6 at E11, 9 at E12, 6 at E13, and 7 at E14. n for EdU until E16.5: n=6 at E14, and 4 at E15.
For pairwise comparisons, * when p<0.05, and ** when p<0.01. For details on the statistical analysis, please see Table 2.

