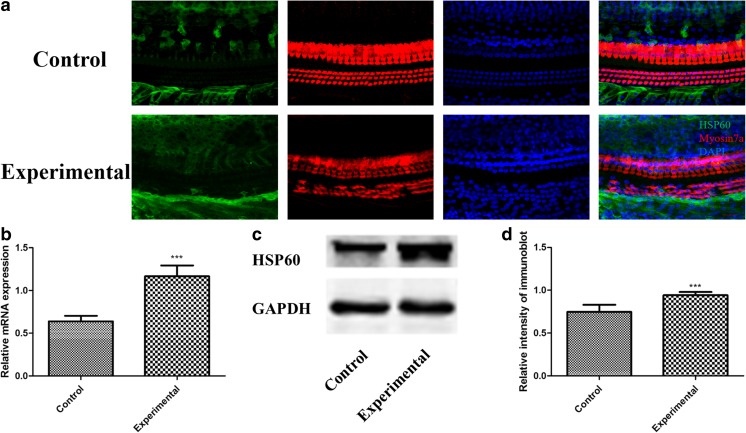
Fig. 4.
Upregulation of HSP60 expression in the cochlea after drug injury. a Immunofluorescence staining showed that HSP60 (green) expression was increased in the experimental group. Myosin7a (red) was used as a HC marker. Scale bar = 20 μm. b, c, and d qRT-PCR and Western blot analysis confirmed that the expression levels of Hsp60 gene and HSP60 protein in the experimental group were significantly higher than those in the control group ***p < 0.001

