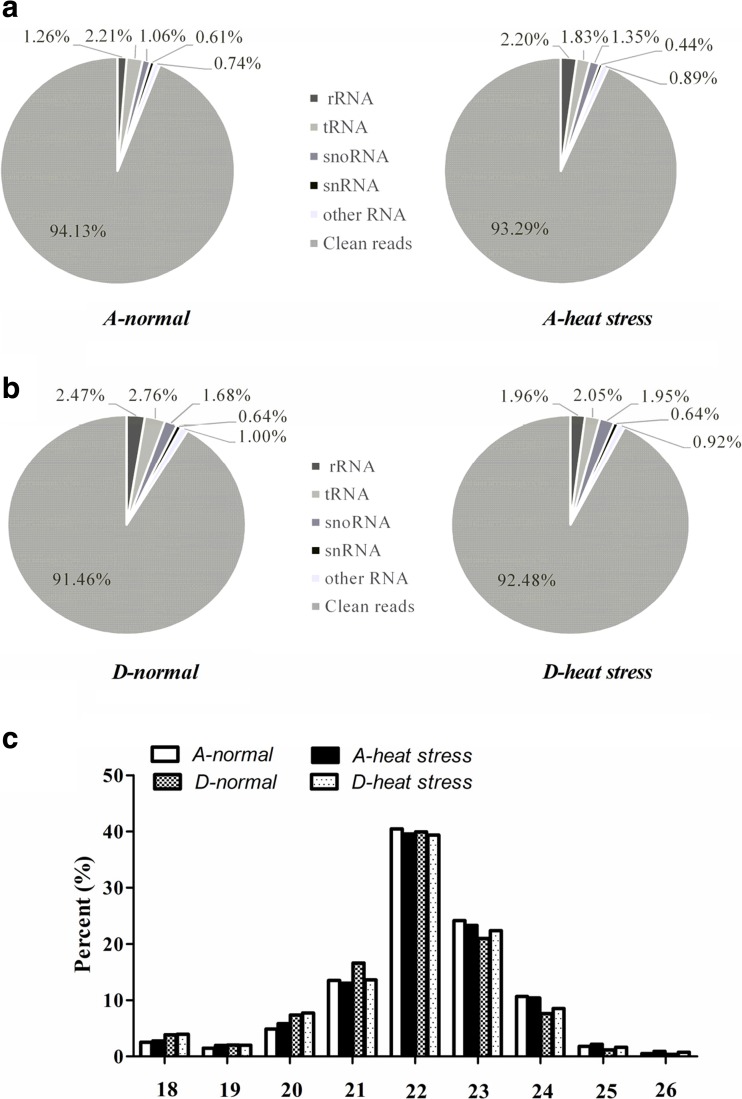
Fig. 2.
Distribution and classification of ncRNAs. a, b Relative proportions of the different ncRNAs. The percent of rRNA, tRNA, snoRNA, snRNA, other RNAs and clean reads were showed in pie diagram. c Length distribution of unique small RNAs in four libraries. A-normal, normal Red Angus; A-heat stress, heat-stressed Red Angus; D-normal, normal Droughtmaster; D-heat stress, heat-stressed Droughtmaster

