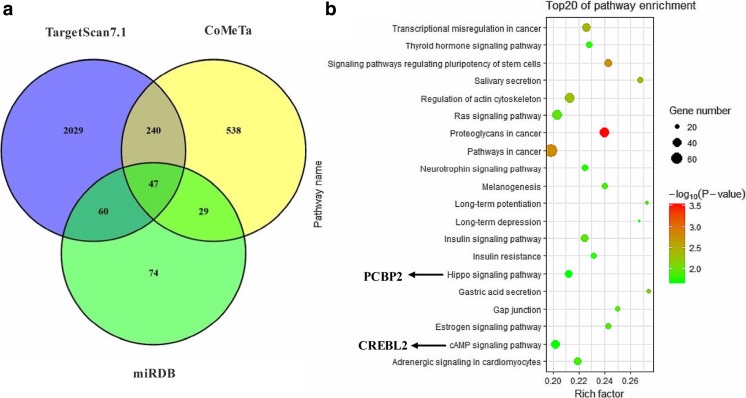
Fig. 4.
Prediction and pathway analysis of miR-1246 target genes. a Venn diagram indicated common and unique differential target genes. b Scatter plot of genes in the top 20 KEGG enrichments. In this diagram, correlated pathways of heat stress were analyzed using the molecule annotation system. X-axis represents the rich target genes of miR-1246, Y-axis represents associated pathway, P represents Benjamin corrected P value, and the black arrow indicates relation to genes within the functional pathway

