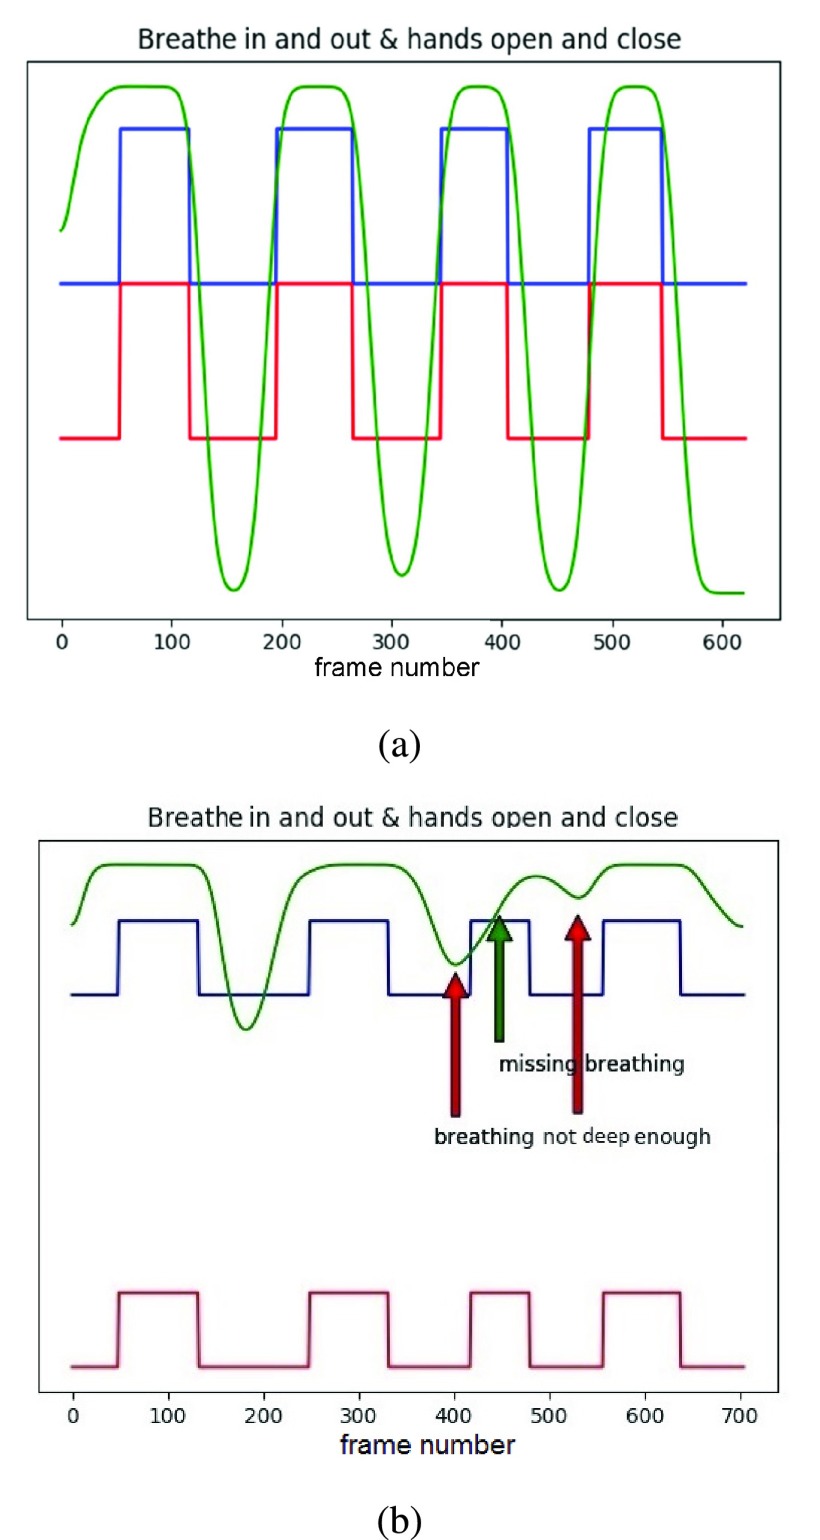
FIGURE 12.
Analysis results of breathing and hand status. In this figure, green curve describes the change of depth value in user’s chest region, where the largest depth difference is 3.5 cm in this case. Blue and red curve represent the states of the left and right hand, respectively, where the higher value corresponds to “close” and small value corresponds to “open”. (a) A case when a user breathes deeply and has perfect synchronization between the breathing state and the hand state. (b) A case when a user does not perform perfectly.

