Figure 1.
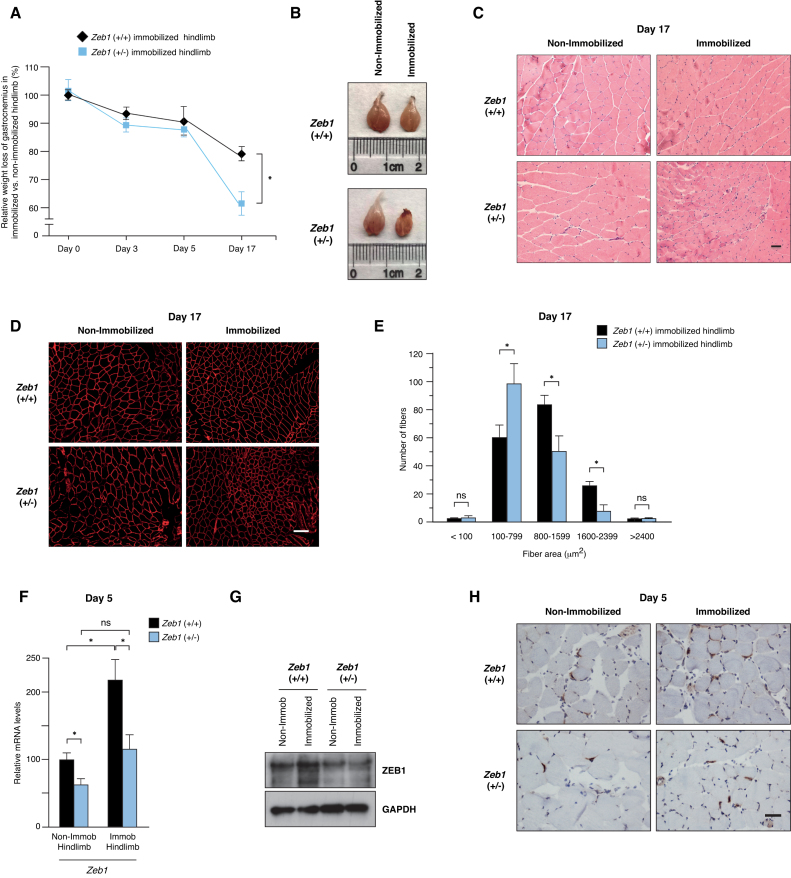
ZEB1 protects skeletal muscle from sparing upon immobilization. (A) Two-to-three-month old wild-type and Zeb1 (+/-) mice were subjected to unilateral hindlimb immobilization for different periods as described in Supplementary Data. At each time point, mice were euthanized and the weight of their immobilized gastrocnemius muscles was assessed with respect to that in the contralateral non-immobilized hindlimb. The weight of the gastrocnemius in the immobilized hindlimb vis-à-vis that in the non-immobilized at the start of the protocol (day 0) was set arbitrarily to 100. At least five mice of each genotype were examined. (B) As in (A), representative images of non-immobilized and immobilized gastrocnemius muscles from wild-type and Zeb1 (+/-) mice at day 17 of the immobilization protocol. (C) Wild-type and Zeb1 (+/-) mice were subjected to unilateral hindlimb immobilization during 17 days as in (A), euthanized and their gastrocnemius muscles stained for hematoxylin/eosin. Scale bar: 50 μm. (D) As in (C), but sections were stained with an antibody against laminin (clone 48H-2). Scale bar: 100 μm. (E) Myofiber cross-sectional analysis in the immobilized gastrocnemius of wild-type and Zeb1 (+/-) mice at day 17 of the immobilization protocol. Myofiber area was assessed as described in Supplementary Data. A total of 160 myofibers were measured from at least eight mice, half from each genotype. (F) Zeb1 expression slightly increases upon immobilization. Wild-type and Zeb1 (+/-) mice were subjected to unilateral hindlimb immobilization during 5 days. At that time, mice were euthanized and Zeb1 messenger RNA (mRNA) levels were assessed in the immobilized and non-immobilized gastrocnemius by qRT-PCR using Gapdh as reference gene. The results are the mean with standard error of at least five mice for each genotype and condition. (G) As in (F), but ZEB1 expression was assessed at the protein level by Western blot. Gastrocnemius muscle lysates were blotted for ZEB1 (clone HPA027524) along with GAPDH (clone 14C10) as loading control. See Supplementary Figure S1E for full unedited blots. The blots shown are a representative of three independent experiments. (H) As in (F), but the ZEB1 expression was assessed by immunohistochemistry (clone H102) at day 5. Captures are representative of at least five mice for each genotype and condition. Scale bar: 40 μm.

