Figure 2.
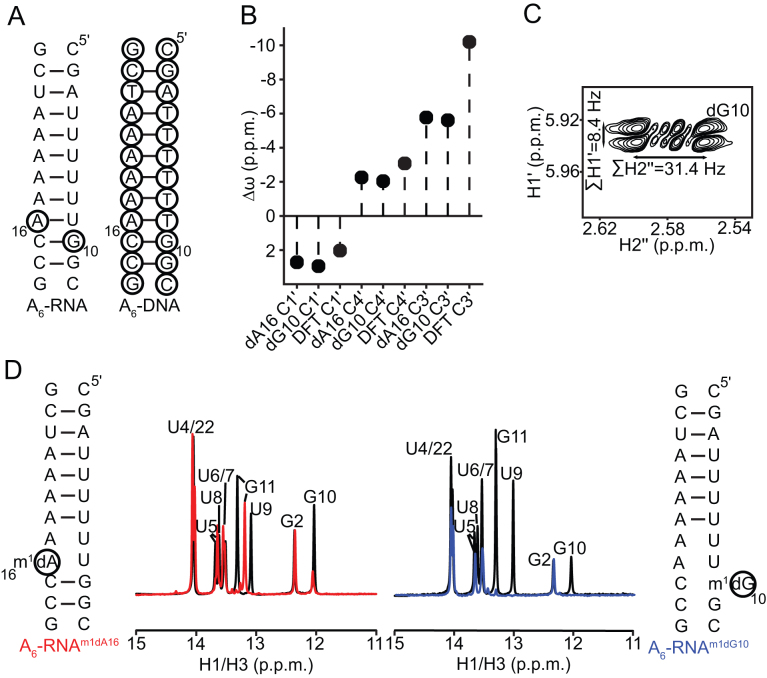
Removal of the 2′-hydroxyl at a purine nucleotide minimally affects the sugar geometry in A6-RNA and does not rescue HG bp formation. (A) Secondary structure of A6-RNA with the sites of dNMP incorporation indicated using black circles, and A6-DNA. (B) Chemical shift perturbations of the sugar resonances of the dNMPs in A6-RNA relative to the corresponding dNMP residues in A6-DNA. Also shown are DFT predicted (70) chemical shift perturbations for the transition of deoxyribonucleosides from a C2′-endo (χ = -100°) to a C3′-endo conformation (χ = −160°). The discrepancy with the expected change in the C3′ chemical shift is likely due to the exclusion of the 3′-phosphate group from the chemical shift calculations (70). (C) DQF-COSY spectrum of A6-RNAdG10 showing the sums of the scalar couplings (∑H1′ = JH1′-H2′ + JH1′-H2″ and ∑H2″ = JH1′-H2″ + JH2′-H2″ + JH2″-H3′) for the H1′ and H2″ protons at the dG10 residue. The corresponding scalar couplings could not be measured for dA16 in A6-RNAdA16 due to severe overlap of the H1′-H2′ and H1′-H2″ cross peaks in the DQF-COSY spectra. Ranges of ∑H1′ and ∑H2″ for C3′-endo and C2′ -endo deoxyribose are 8–11 Hz and 30–33 Hz, and 15–16 Hz and 19–21 Hz respectively (72). (D) Comparison of 1H 1D spectra of the imino region of A6-RNAm1dA16 (red) and A6-RNAm1dG10 (blue), with the spectra for A6-RNAdA16 and A6-RNAdG10 (black). All NMR spectra were collected in pH 5.4, 25 mM NaCl and at 25°C.

