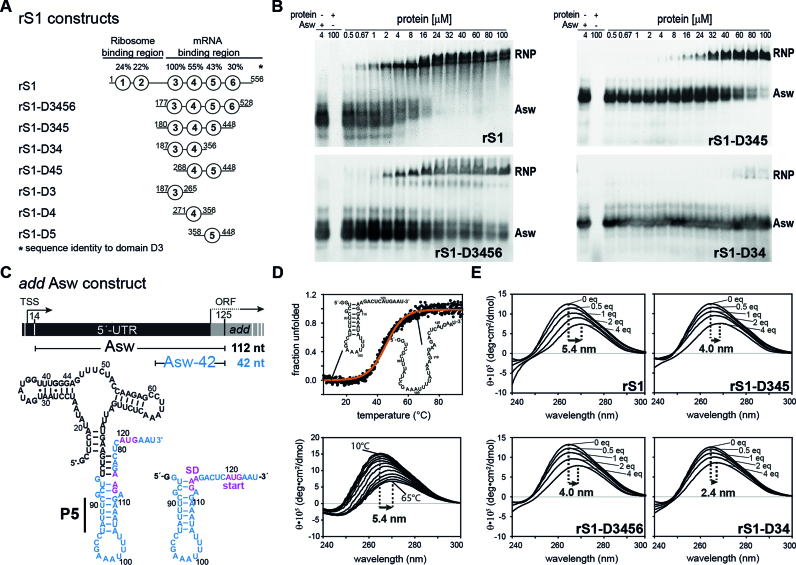
Figure 1.
RNA-binding and –chaperone activity of rS1 and its truncated versions. (A) Schematic overview of the rS1 constructs used in this study. Fragments are aligned according to their amino acid sequence. Sequence identities compared to domain D3 are displayed on the top. (B) Electrophoretic mobility shift assays (EMSAs) of selected rS1 constructs, using full-length add Asw (4 μM) as RNA substrate. Increasing protein concentrations are depicted on the top of the gels. The EMSAs were performed on discontinuous gels and only the resolving phases are displayed. Bands reporting on complex formation or free RNA are labeled with RNP or Asw, respectively. Two bands are observed for the free RNA, as the ligand-free riboswitch adopts two conformations (apoA and apoB) (38). In case of the full-length rS1 these states are also resolved for the RNP, since the EMSA was performed at higher powers in order to ensure migration of the complex into the resolving phase of the gel. In addition for the full-length rS1 a high-molecular species was observed (<5%) that did not migrate into the resolving phase of the discontinuous gel (not displayed). (C) Schematic overview of add Asw constructs. Asw-42 is highlighted in blue and the location of the P5 helix is indicated. The add gene from V. vulnificus including the transcription start site (TSS) and the open reading frame (ORF) is displayed on the top. (D) Thermal unfolding of Asw-42 (10 μM) to visualize the red-shift of CD maxima upon RNA melting. Temperature-dependent CD spectra of Asw-42 are shown. They were used as a benchmark for CD titration experiments reporting on RNA melting. (E) rS1-induced unfolding of Asw-42 (10 μM) as measured by CD spectra. All CD titration experiments were carried out at 10°C. Molar ratios of [protein]:[RNA] are depicted in the plots. The maximal shifts are displayed.

