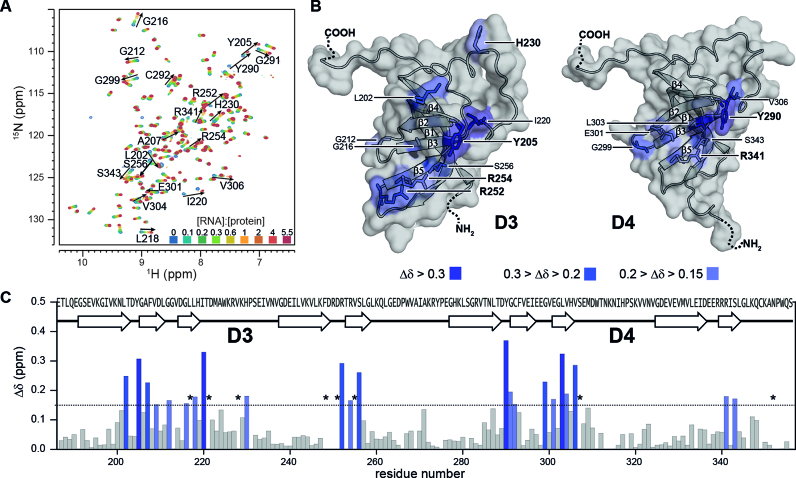
Figure 3.
Interaction of rS1-D34 with Asw-14. (A) Superposition of 1H-15N-BEST-TROSY acquired at 35°C and 600 MHz. NMR titration was performed with 100 μM 15N-labeled rS1-D34. Unlabeled Asw-14 was added stepwise with ratios ranging from 0 to 5.5 equivalents. The molar ratio ([RNA]:[protein]) is color coded within the superimposed spectra. (B) Cartoon representations of D3 and D4 model structures that were generated in SWISS-MODEL (71–74) using the PDB entry 2KHI (18) as template for homology modeling. Observed chemical shift perturbations of binding site reporters are plotted and color coded according to CSP values. The surface is displayed and solvent exposed residues are additionally shown as sticks. Surface binding site reporters are annotated and basic and aromatic residues are highlighted. (C) Chemical shift perturbations, calculated as described in the method section, between free and bound rS1-D34 are plotted as function of rS1-D34 sequence. Horizontal line indicates threshold value that was used to identify binding site reporters (53). Asterisks mark residues that are undetectable due to RNA-induced exchange broadening. Missing values represent either prolines or undetectable residues (G213, R250, W311, N313, N315 are exchange broadened at 35°C. D249, T253, K314, L346, A269 and C349 could not be assigned as the amide resonances were absent from 1H–15N-correlation spectra).

