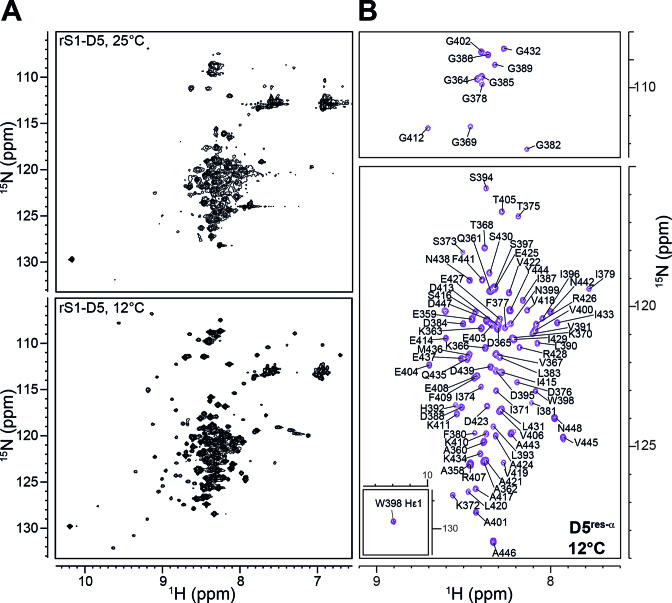
Figure 4.
The two conformational states of rS1-D5. (A) 1H–15N-HSQC spectra were acquired at the displayed temperatures and at 900 MHz. (B) Annotated resonance assignment for D5res-α. The spectrum (acquired at 12°C and 900 MHz) is identical to the spectrum in panel (A) but to exclusively display the predominantly unstructured D5 state, the 1H–15N-HSQC is plotted at higher contour levels.

